Metrics
Monitor serverless function performance in the Nhost dashboard — invocations, response times, response sizes, and error rates over an interactive time range.
function metrics monitoring observability invocations response times error rate dashboard serverless functions pro plan team planThe Metrics tab shows performance data for an individual function — how often it is invoked, how fast it responds, how much data it returns, and how often it fails — over a time range you choose.
Viewing Metrics
Section titled “Viewing Metrics”Metrics require at least one deployed function that has received traffic. If you don’t have one yet, follow Getting Started to create and deploy your first function.
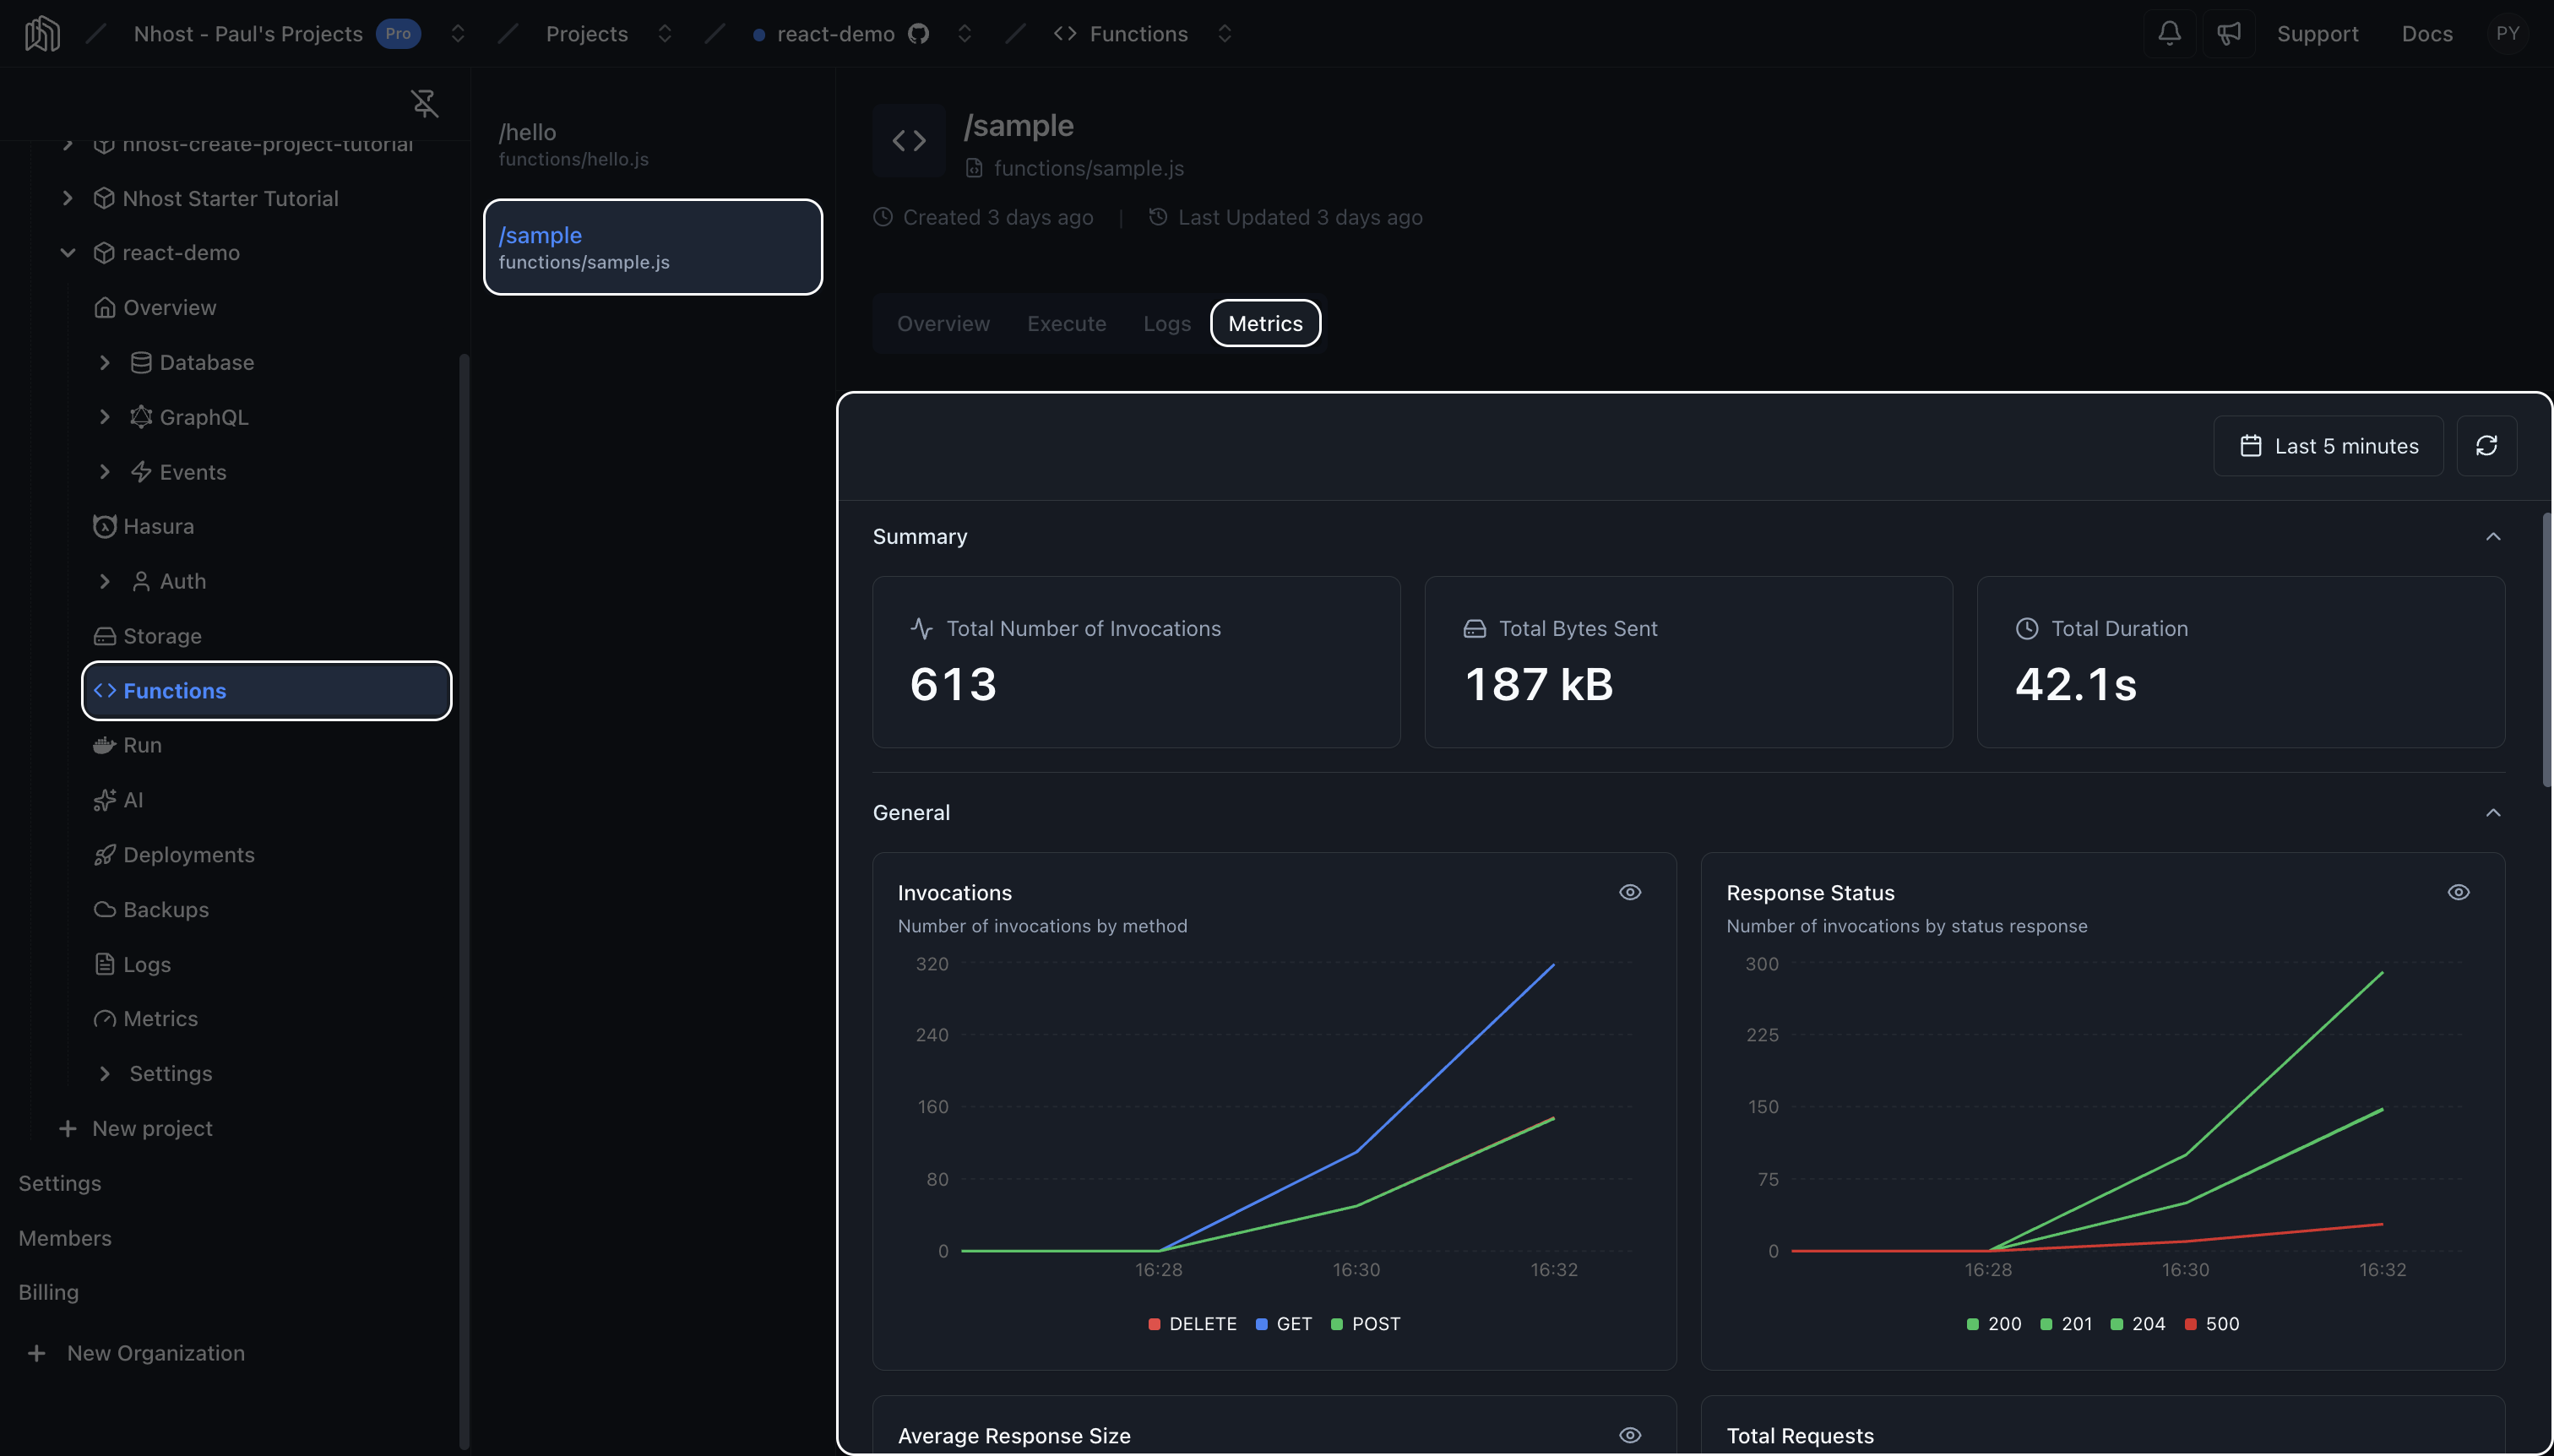
Open the Nhost dashboard and go to Functions > your function > Metrics. Metrics are scoped to the function you are viewing.
Time Range
Section titled “Time Range”Use the time range filter at the top of the pane to choose the window.
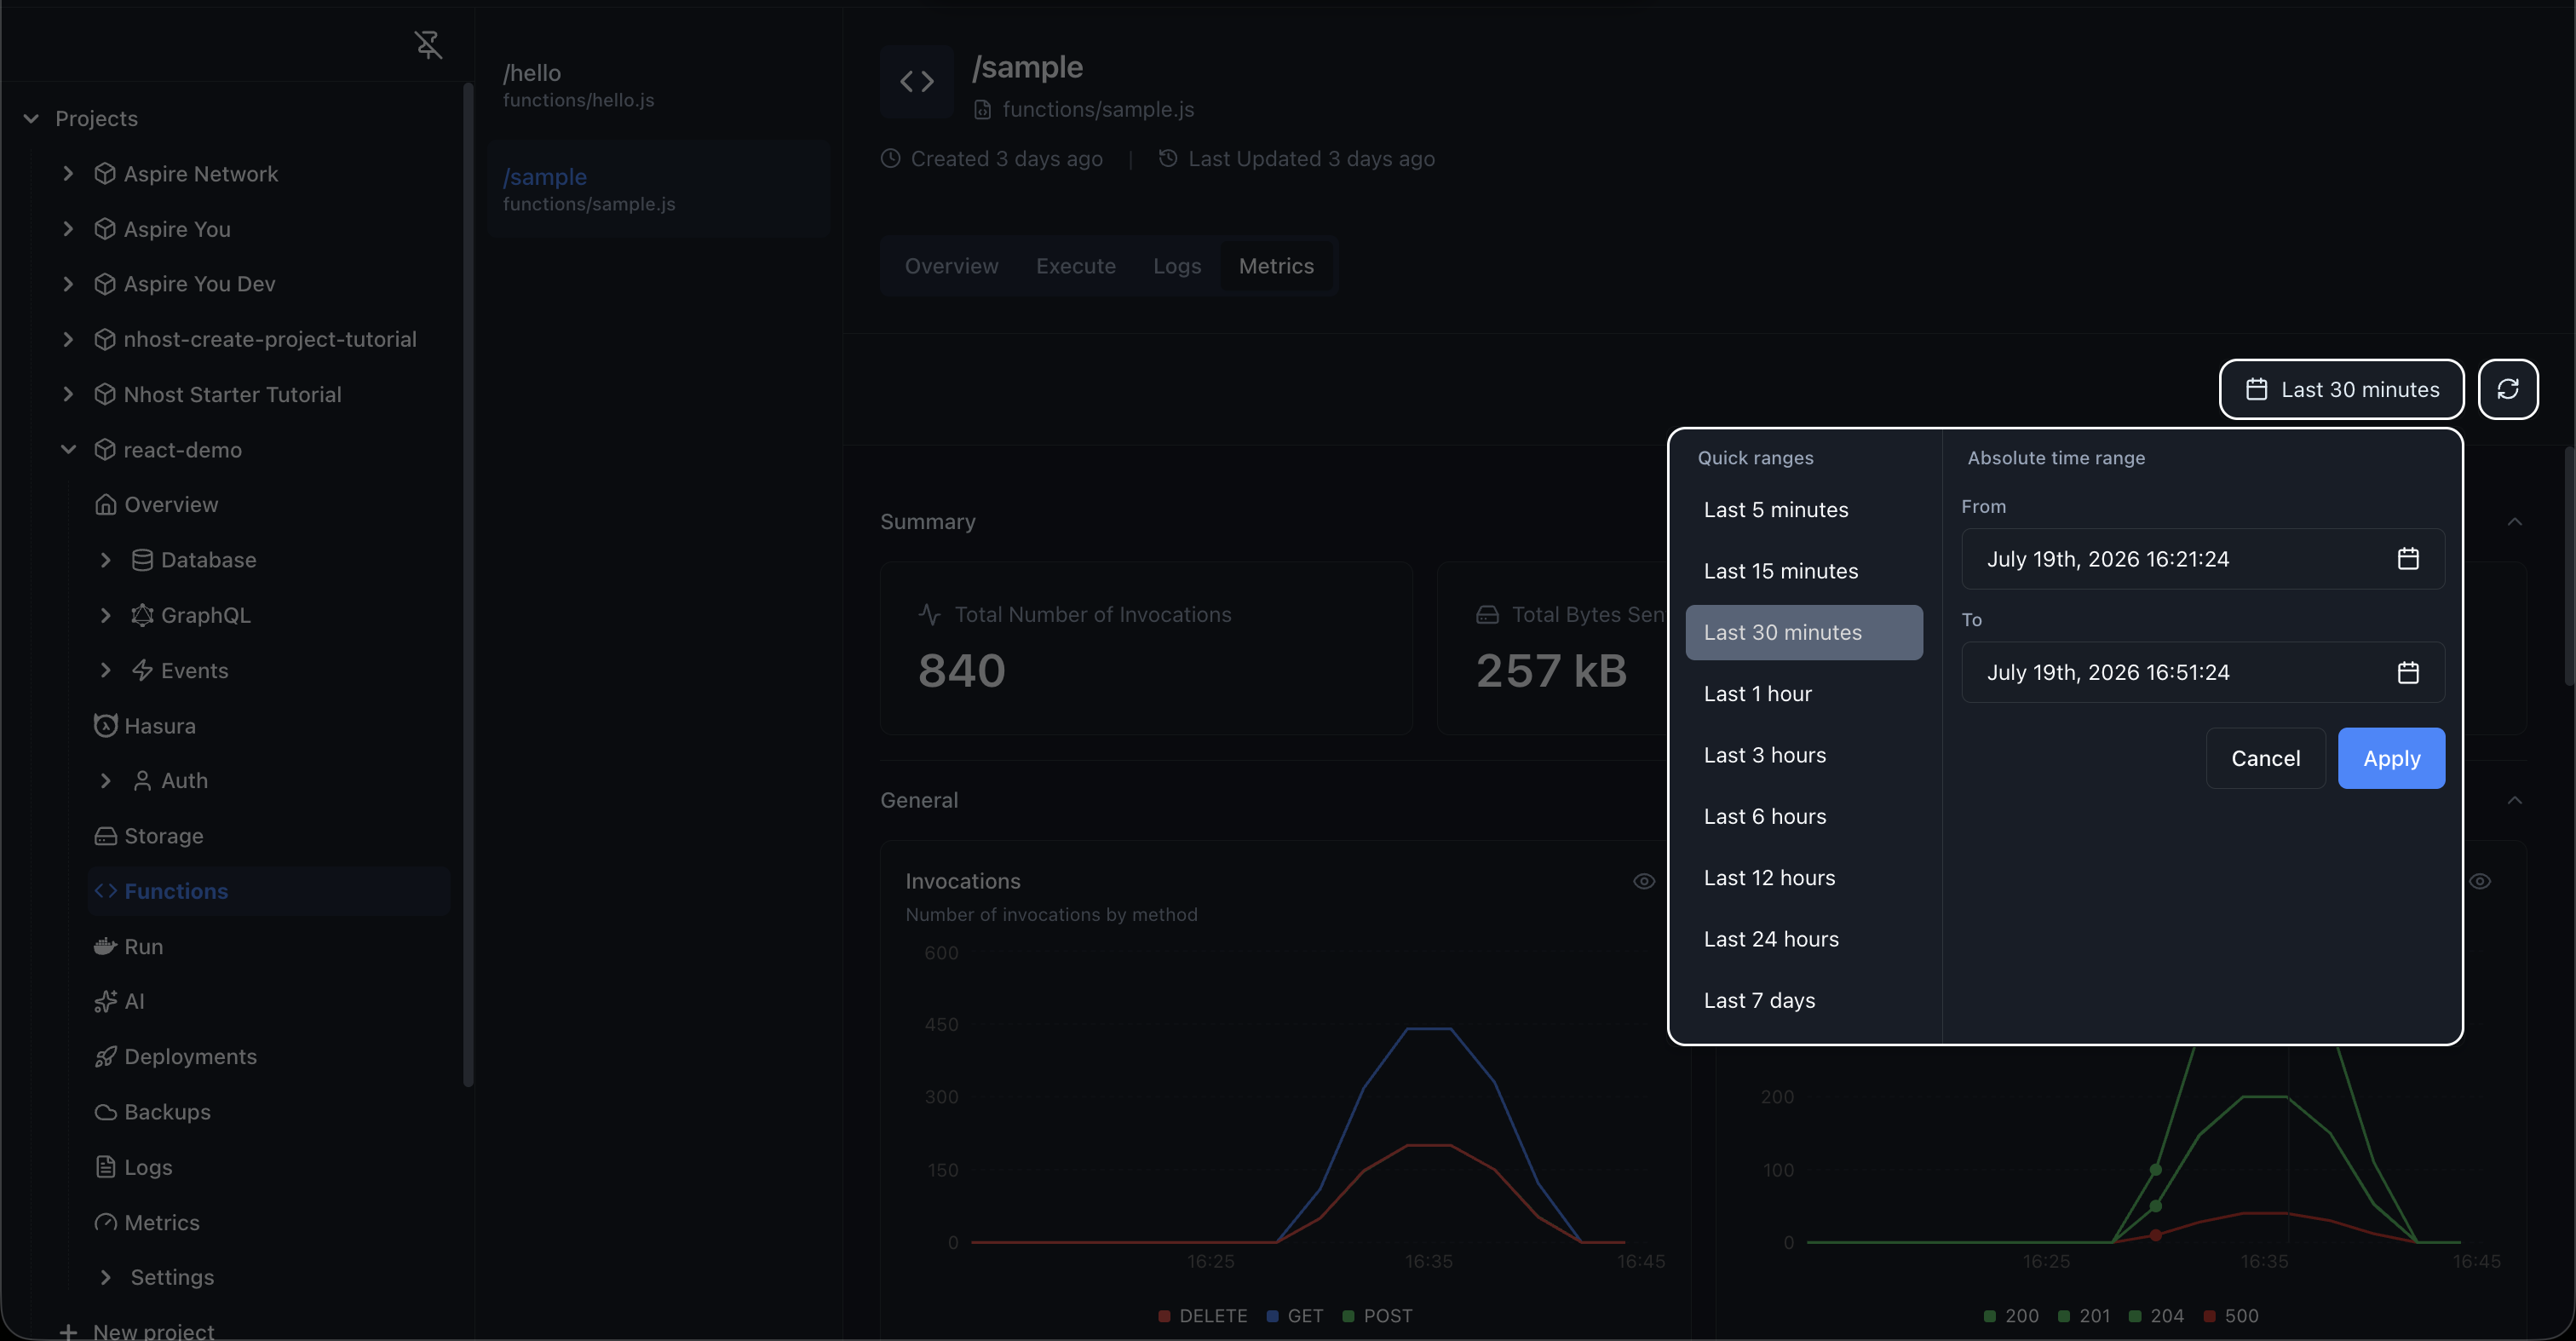
Pick a quick range or set an absolute time range:
- Quick ranges — Last 5 minutes, 15 minutes, 30 minutes, 1 hour, 3 hours, 6 hours, 12 hours, 24 hours, and 7 days. The default is the last 6 hours.
- Absolute time range — set explicit From and To timestamps.
The refresh button beside the filter reloads the latest data for the current range.
Summary
Section titled “Summary”Three cards summarize the selected time range.

- Total Number of Invocations — how many times the function ran
- Total Bytes Sent — combined size of all responses
- Total Duration — combined execution time across all invocations
Sections
Section titled “Sections”Metrics are grouped into three sections. Each section contains related charts and tables; chart series are broken down by HTTP method, except where noted.
General
Section titled “General”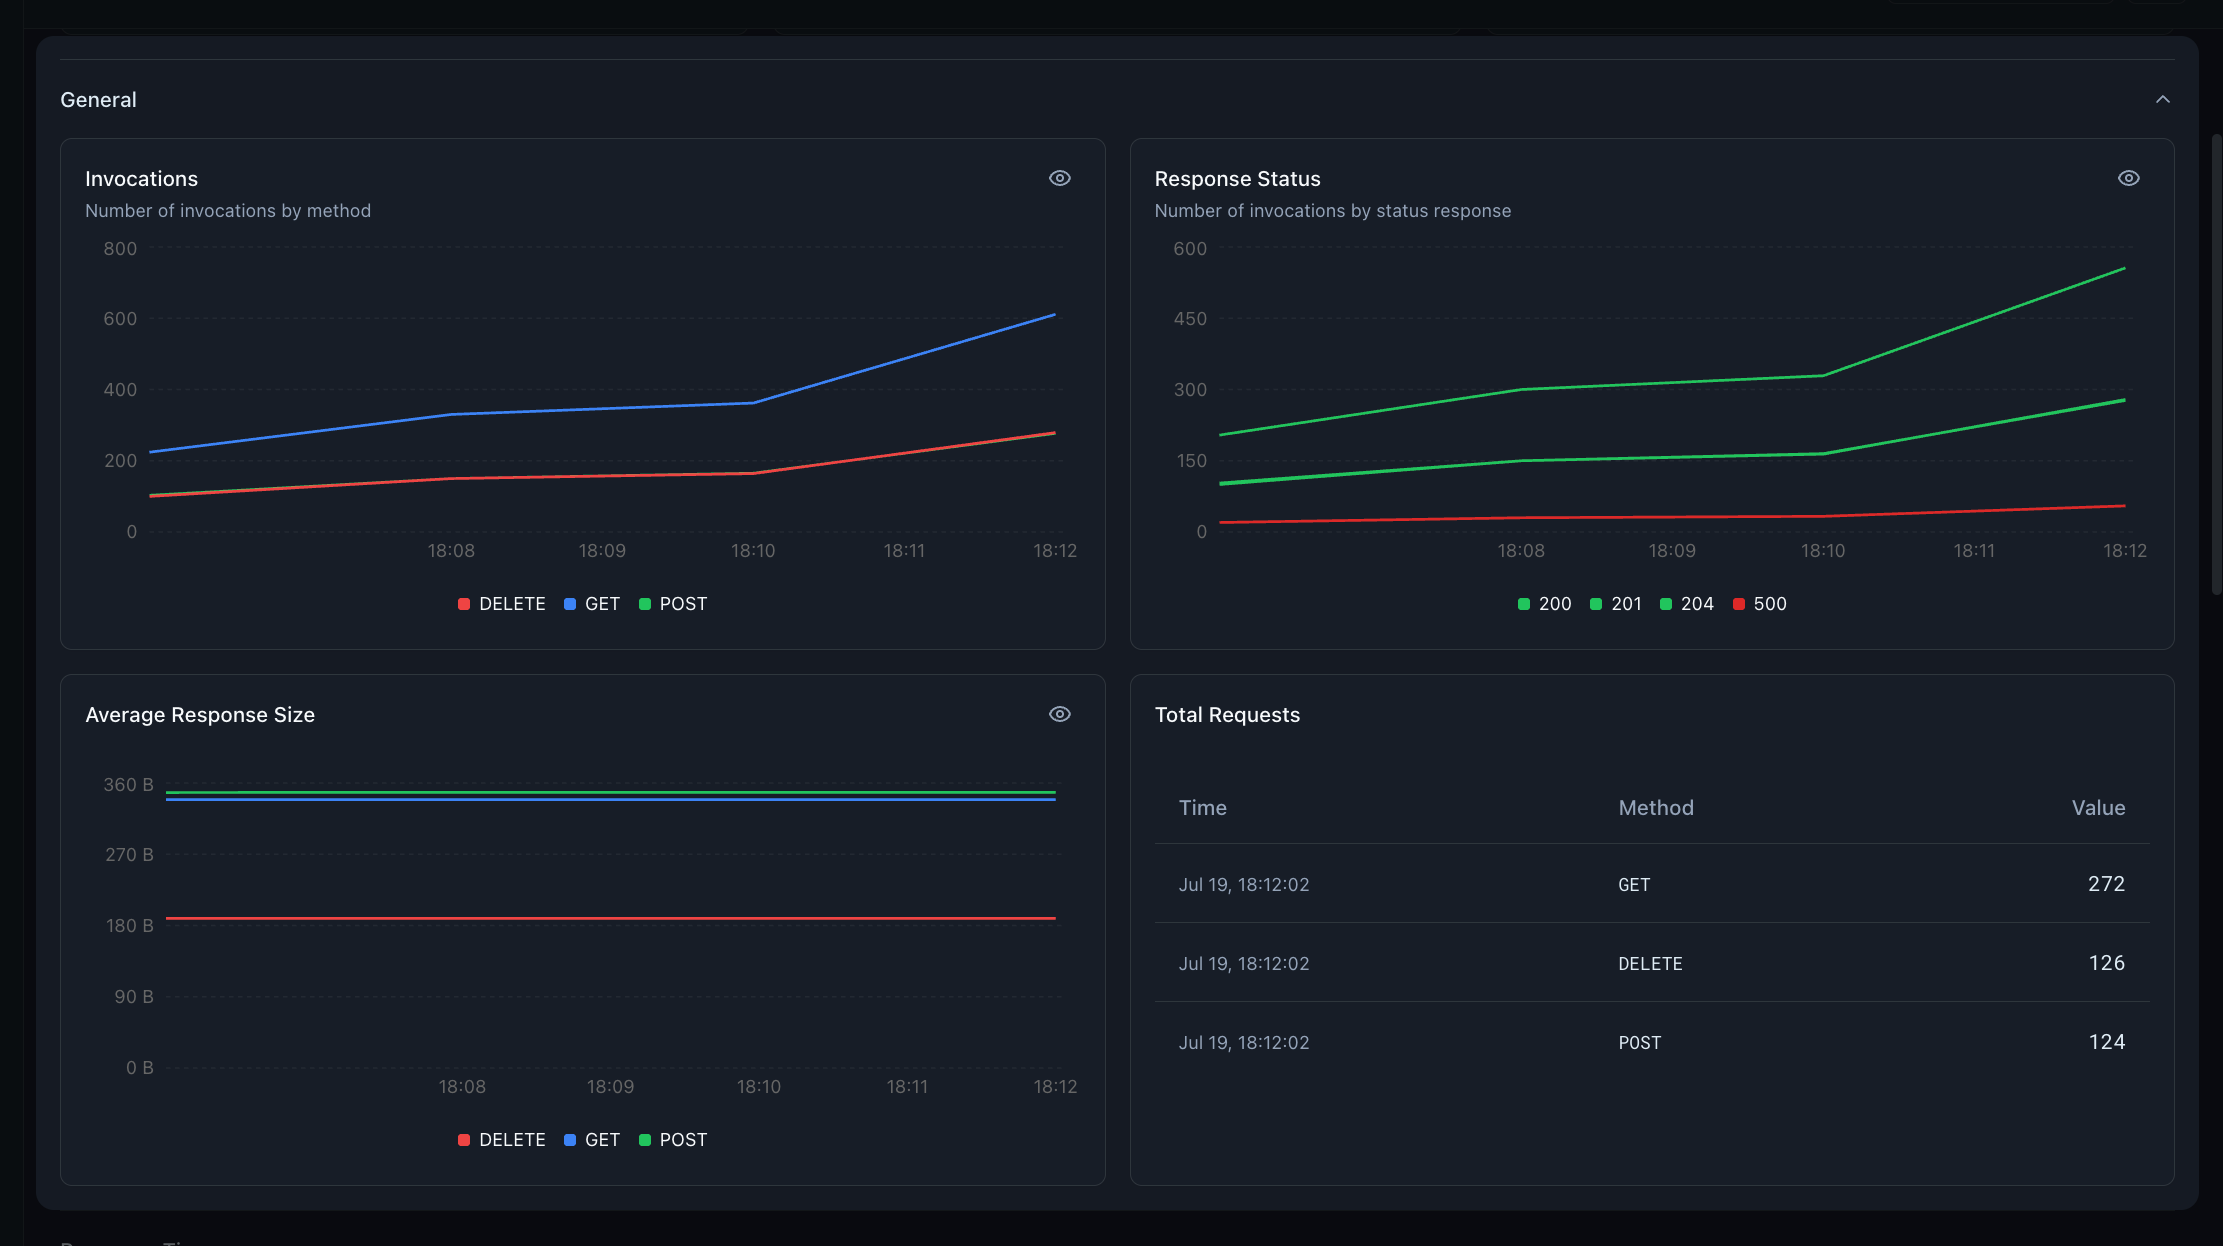
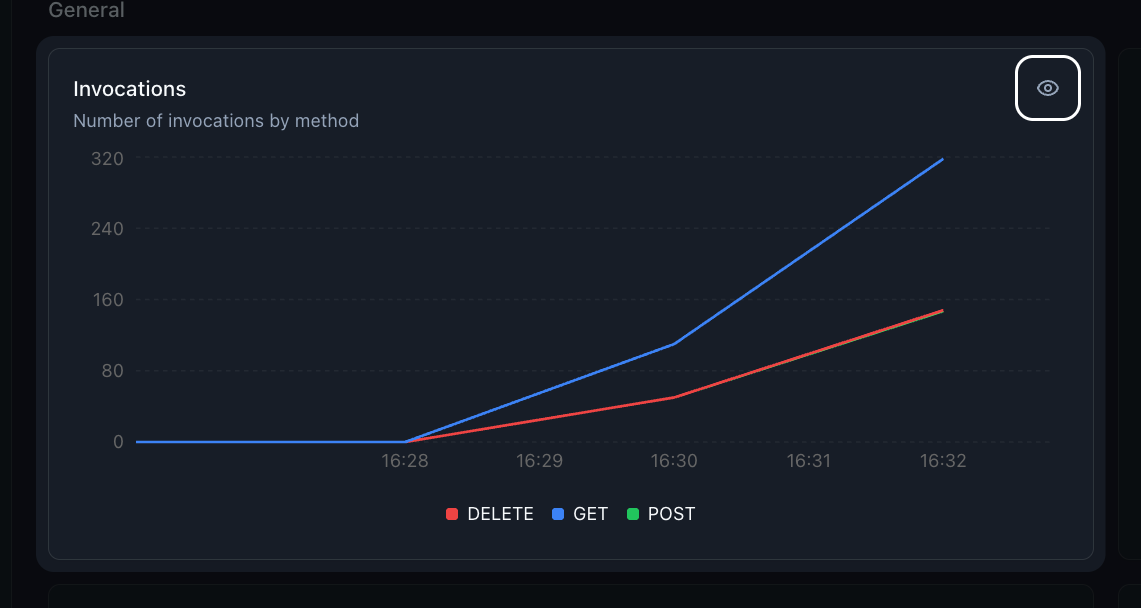
- Invocations — number of invocations, by HTTP method.
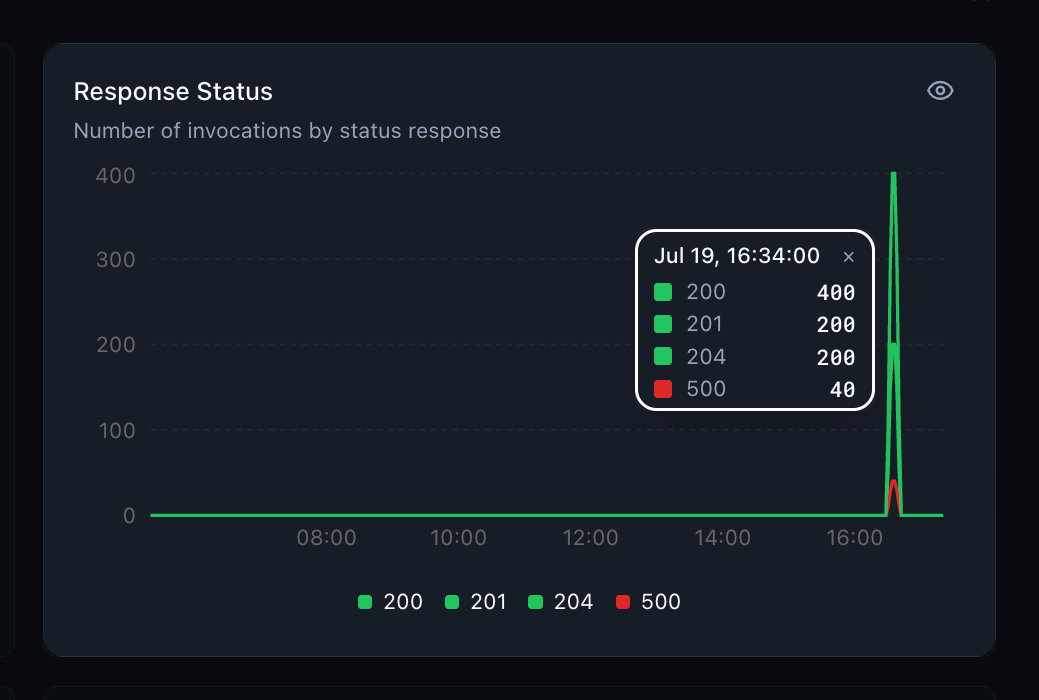
- Response Status — number of invocations, by response status code.
- Average Response Size — average bytes returned per response.
- Total Requests — a table listing request counts, one row per HTTP method, each showing:
- Time — the selected time range’s end timestamp
- Method — HTTP method of the request
- Value — number of requests for that method
Response Times
Section titled “Response Times”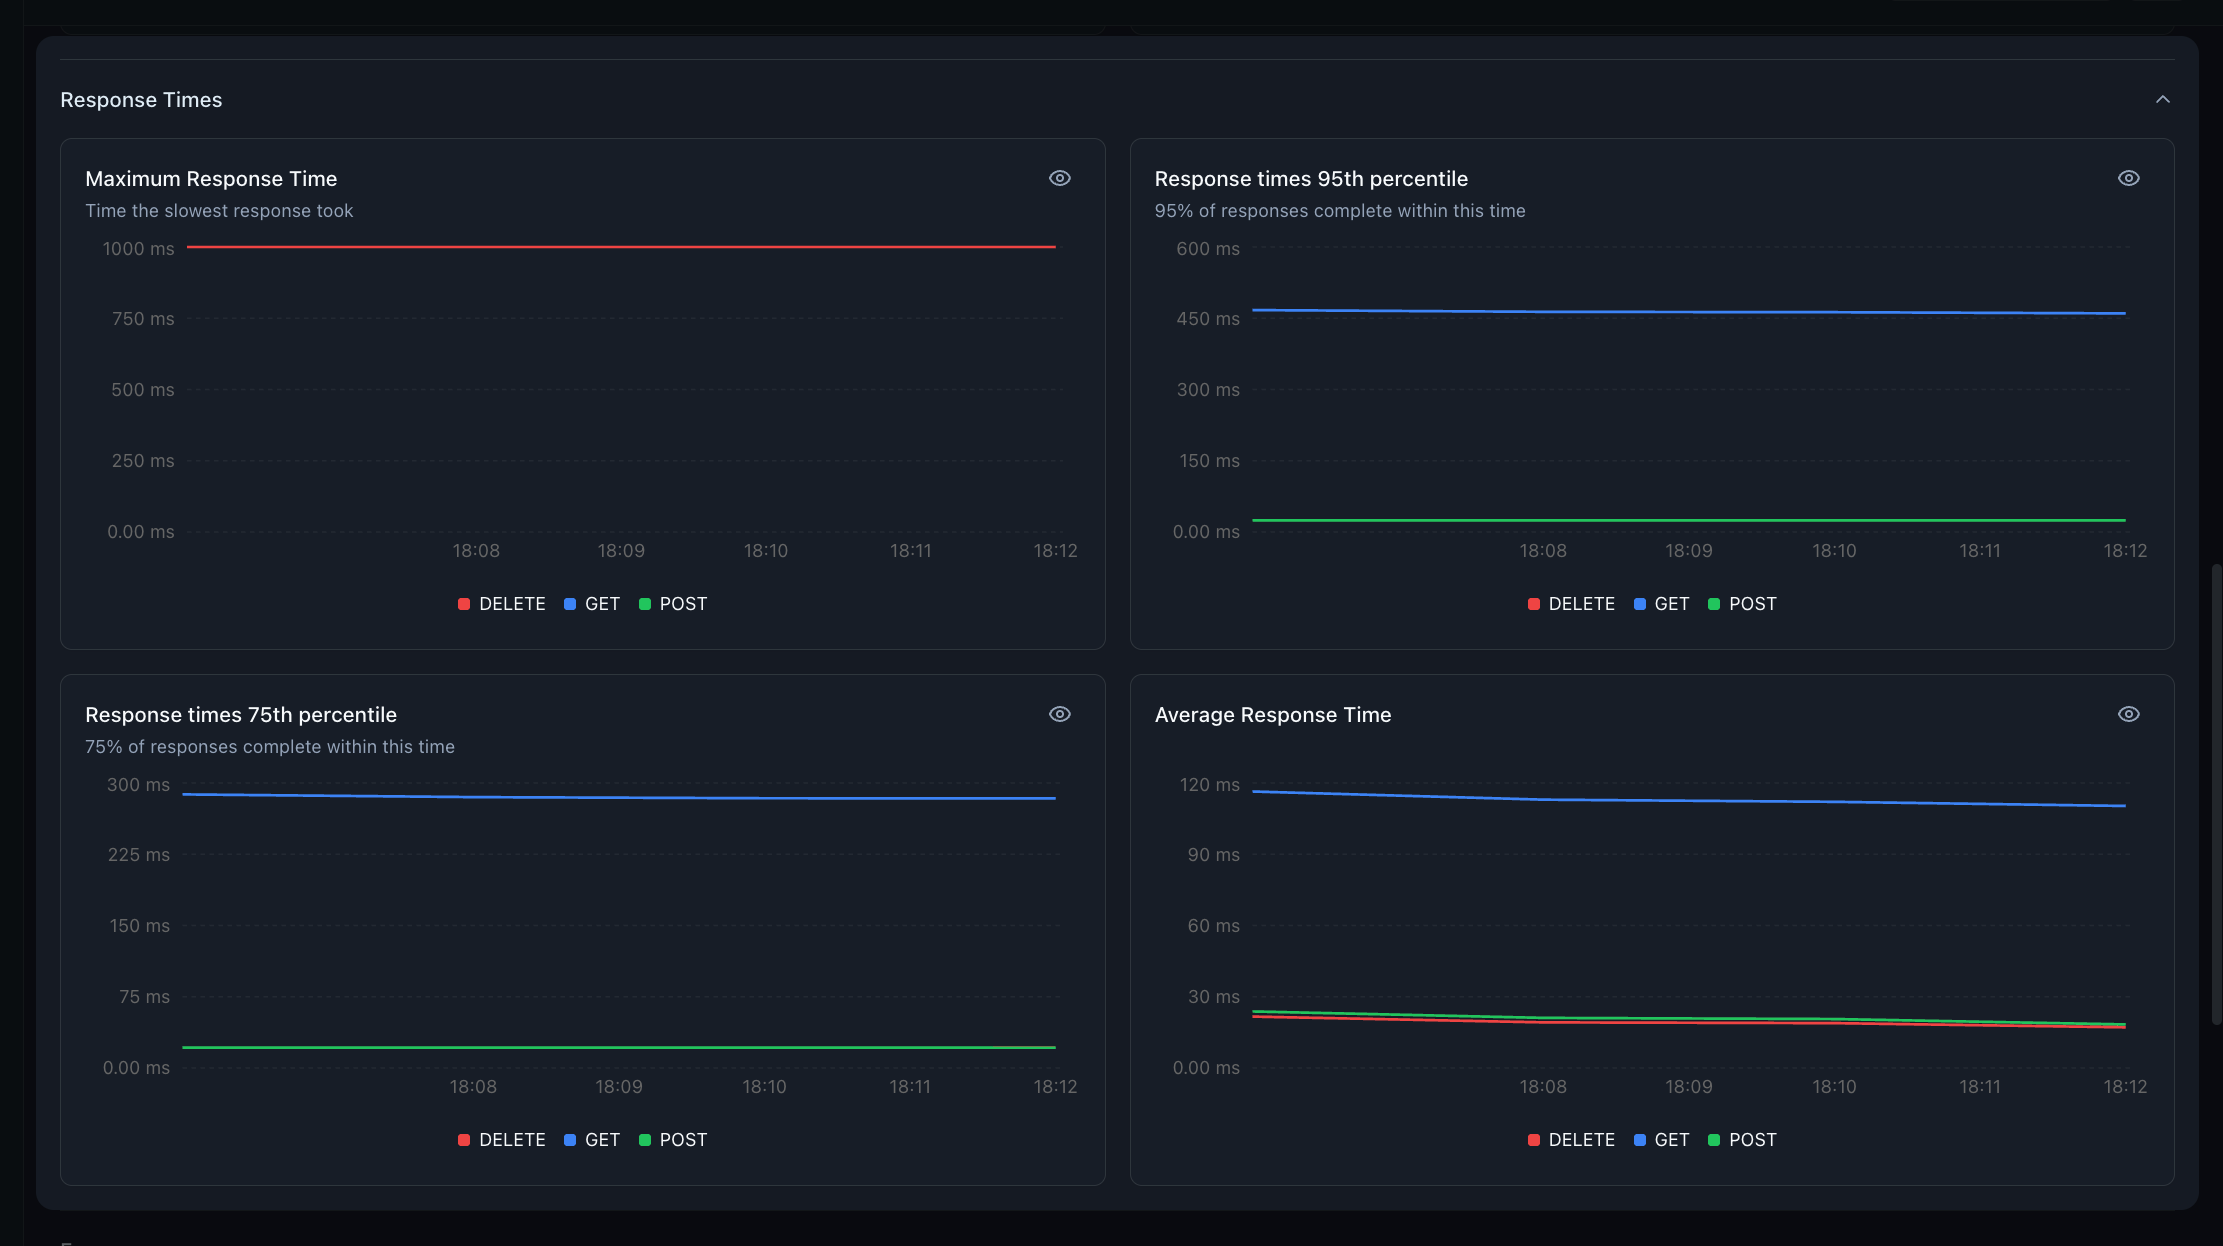
- Maximum Response Time — the slowest response in each interval.
- Response times 95th percentile — 95% of responses complete within this time.
- Response times 75th percentile — 75% of responses complete within this time.
- Average Response Time — mean response time.
Errors
Section titled “Errors”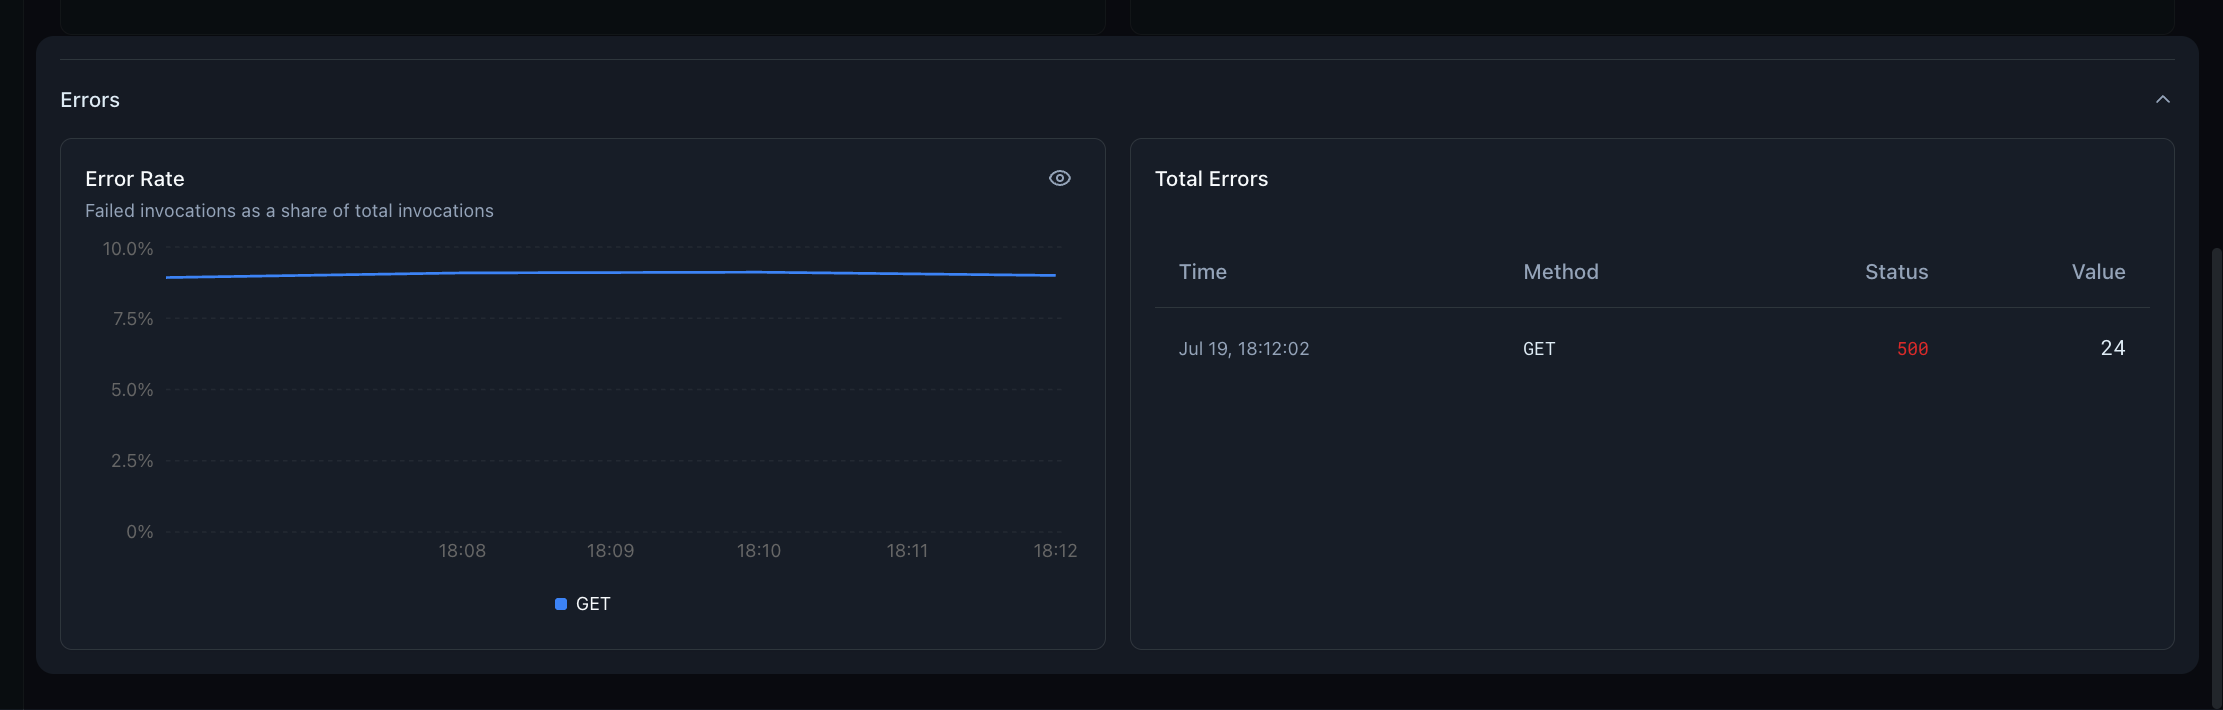
- Error Rate — failed invocations as a share of total invocations.
- Total Errors — a table listing individual failed invocations, one row per error, each showing:
- Time — the selected time range’s end timestamp
- Method — HTTP method of the request
- Status — response status code returned
- Value — number of failed invocations for that time, method, and status
Interacting with Charts
Section titled “Interacting with Charts”- Zoom — drag horizontally across a chart to zoom into that window, or double-click to zoom out (the visible span doubles each time, centered on the current window, up to a maximum of 90 days).
- Pin the tooltip — click a data point to pin the hover tooltip in place so you can read exact values; click again or press
Escto unpin.
- Toggle series — click a legend item to isolate that series; click it again to restore all series. Hold
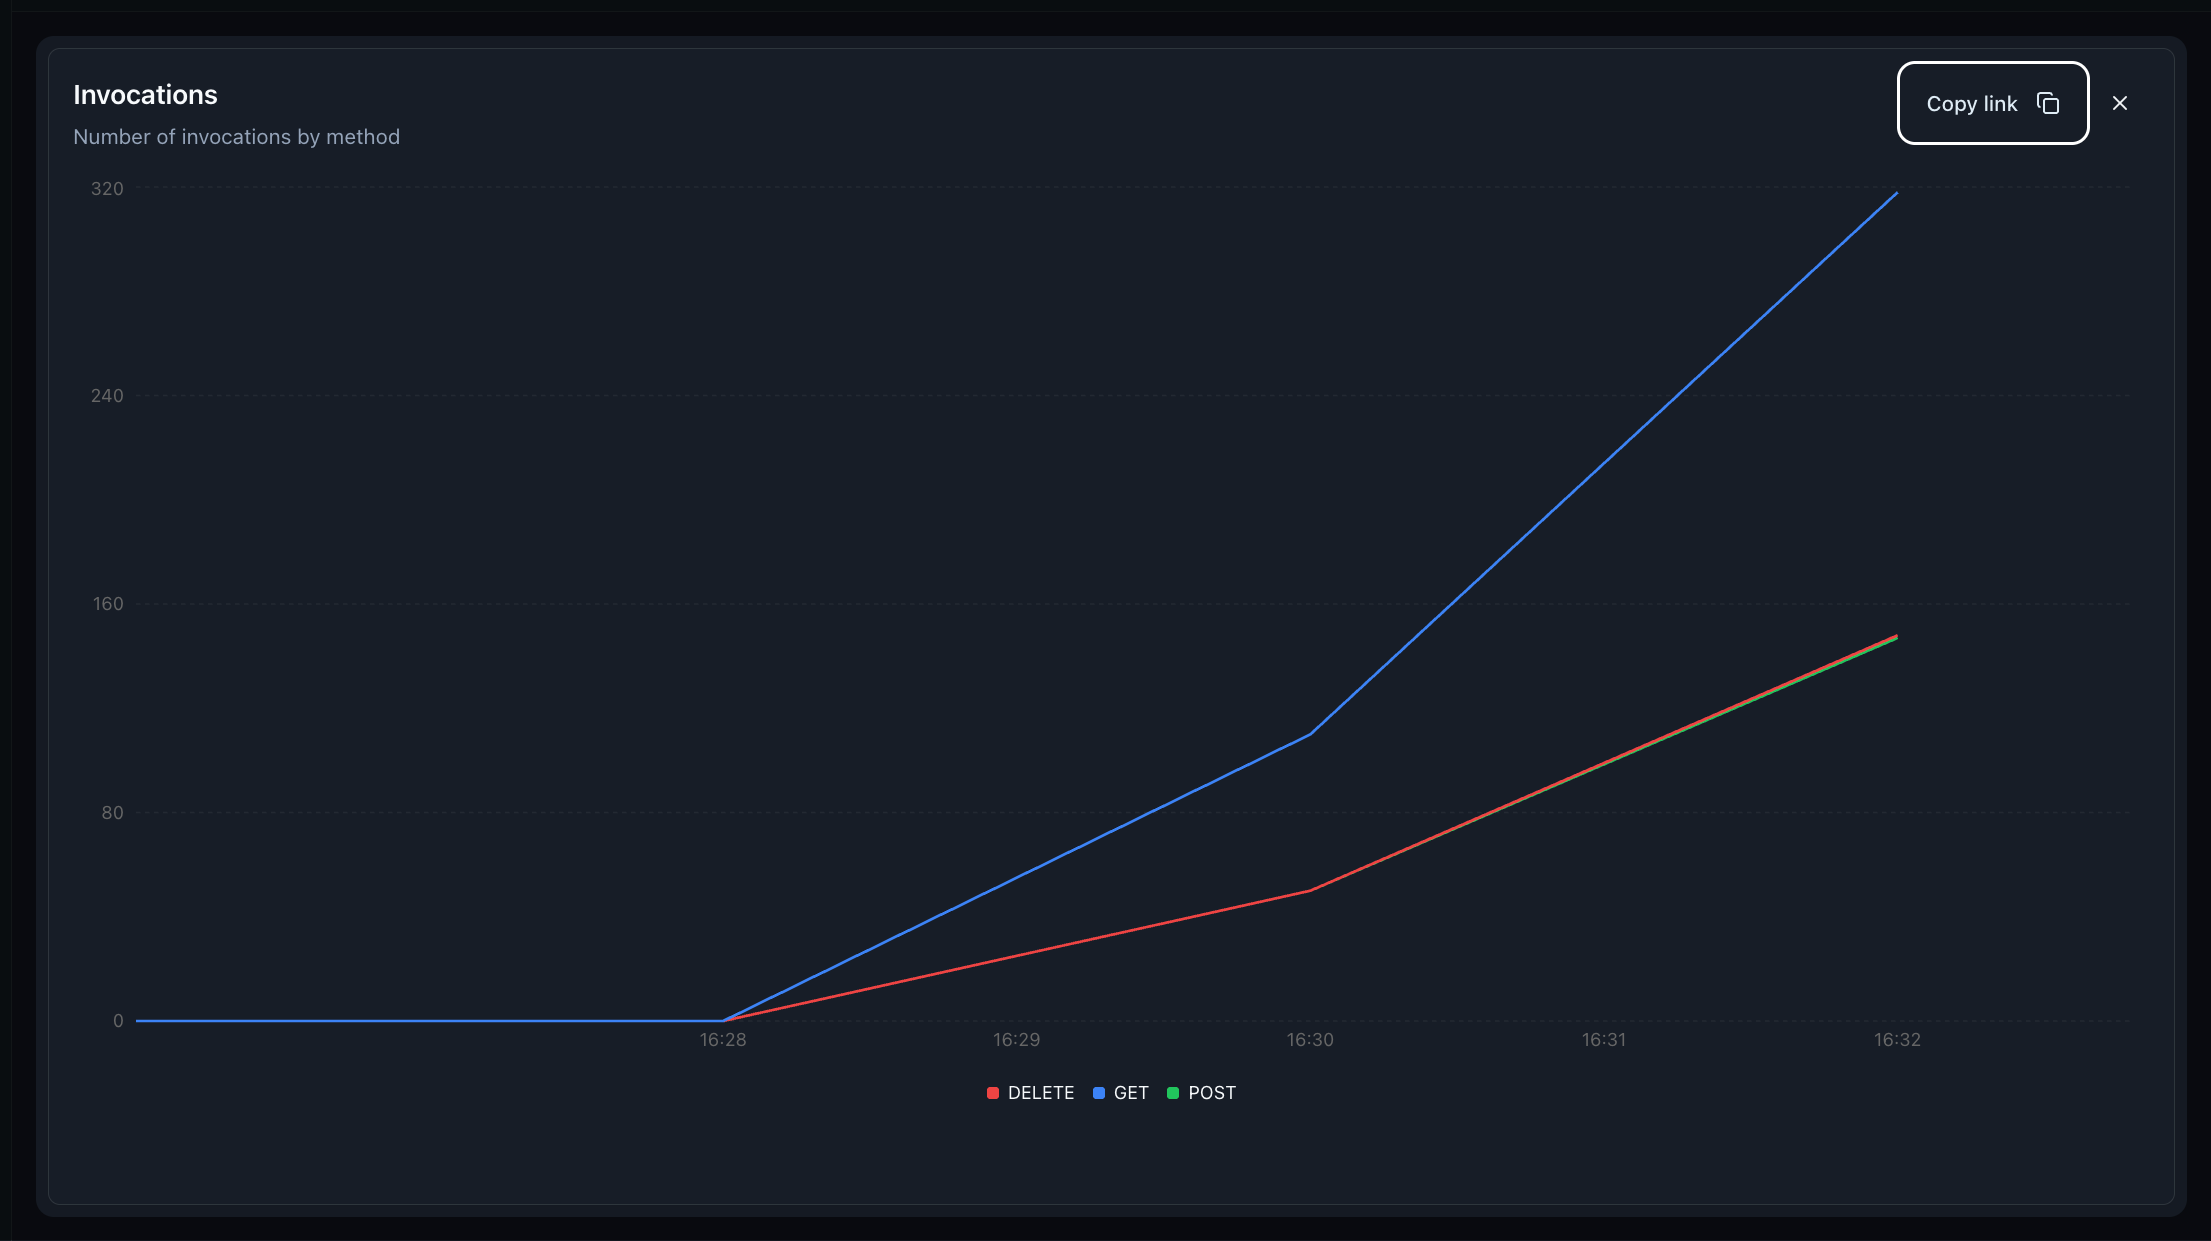
⌘/Ctrl/Shiftwhile clicking to show or hide individual series. - Expand a chart — click the in a chart’s top-right corner to open it into a full-width panel for a closer look.
- Share a view — in the expanded panel, click Copy link to copy a URL that captures the current time range, expanded panel, and hidden series, so you can share the exact view with a teammate.