

Metrics
Monitor response times, resource usage, and error rates through a managed Grafana instance with pre-built dashboards for your services.
metrics Grafana monitoring observability alerting performance dashboardsInsights such as response times, resource usage, and error rates, to help you assess the performance and health of your services.
Metrics helps you analyze the performance of your infrastructure, while identifying bottlenecks and optimizing your applications.
Managed Grafana
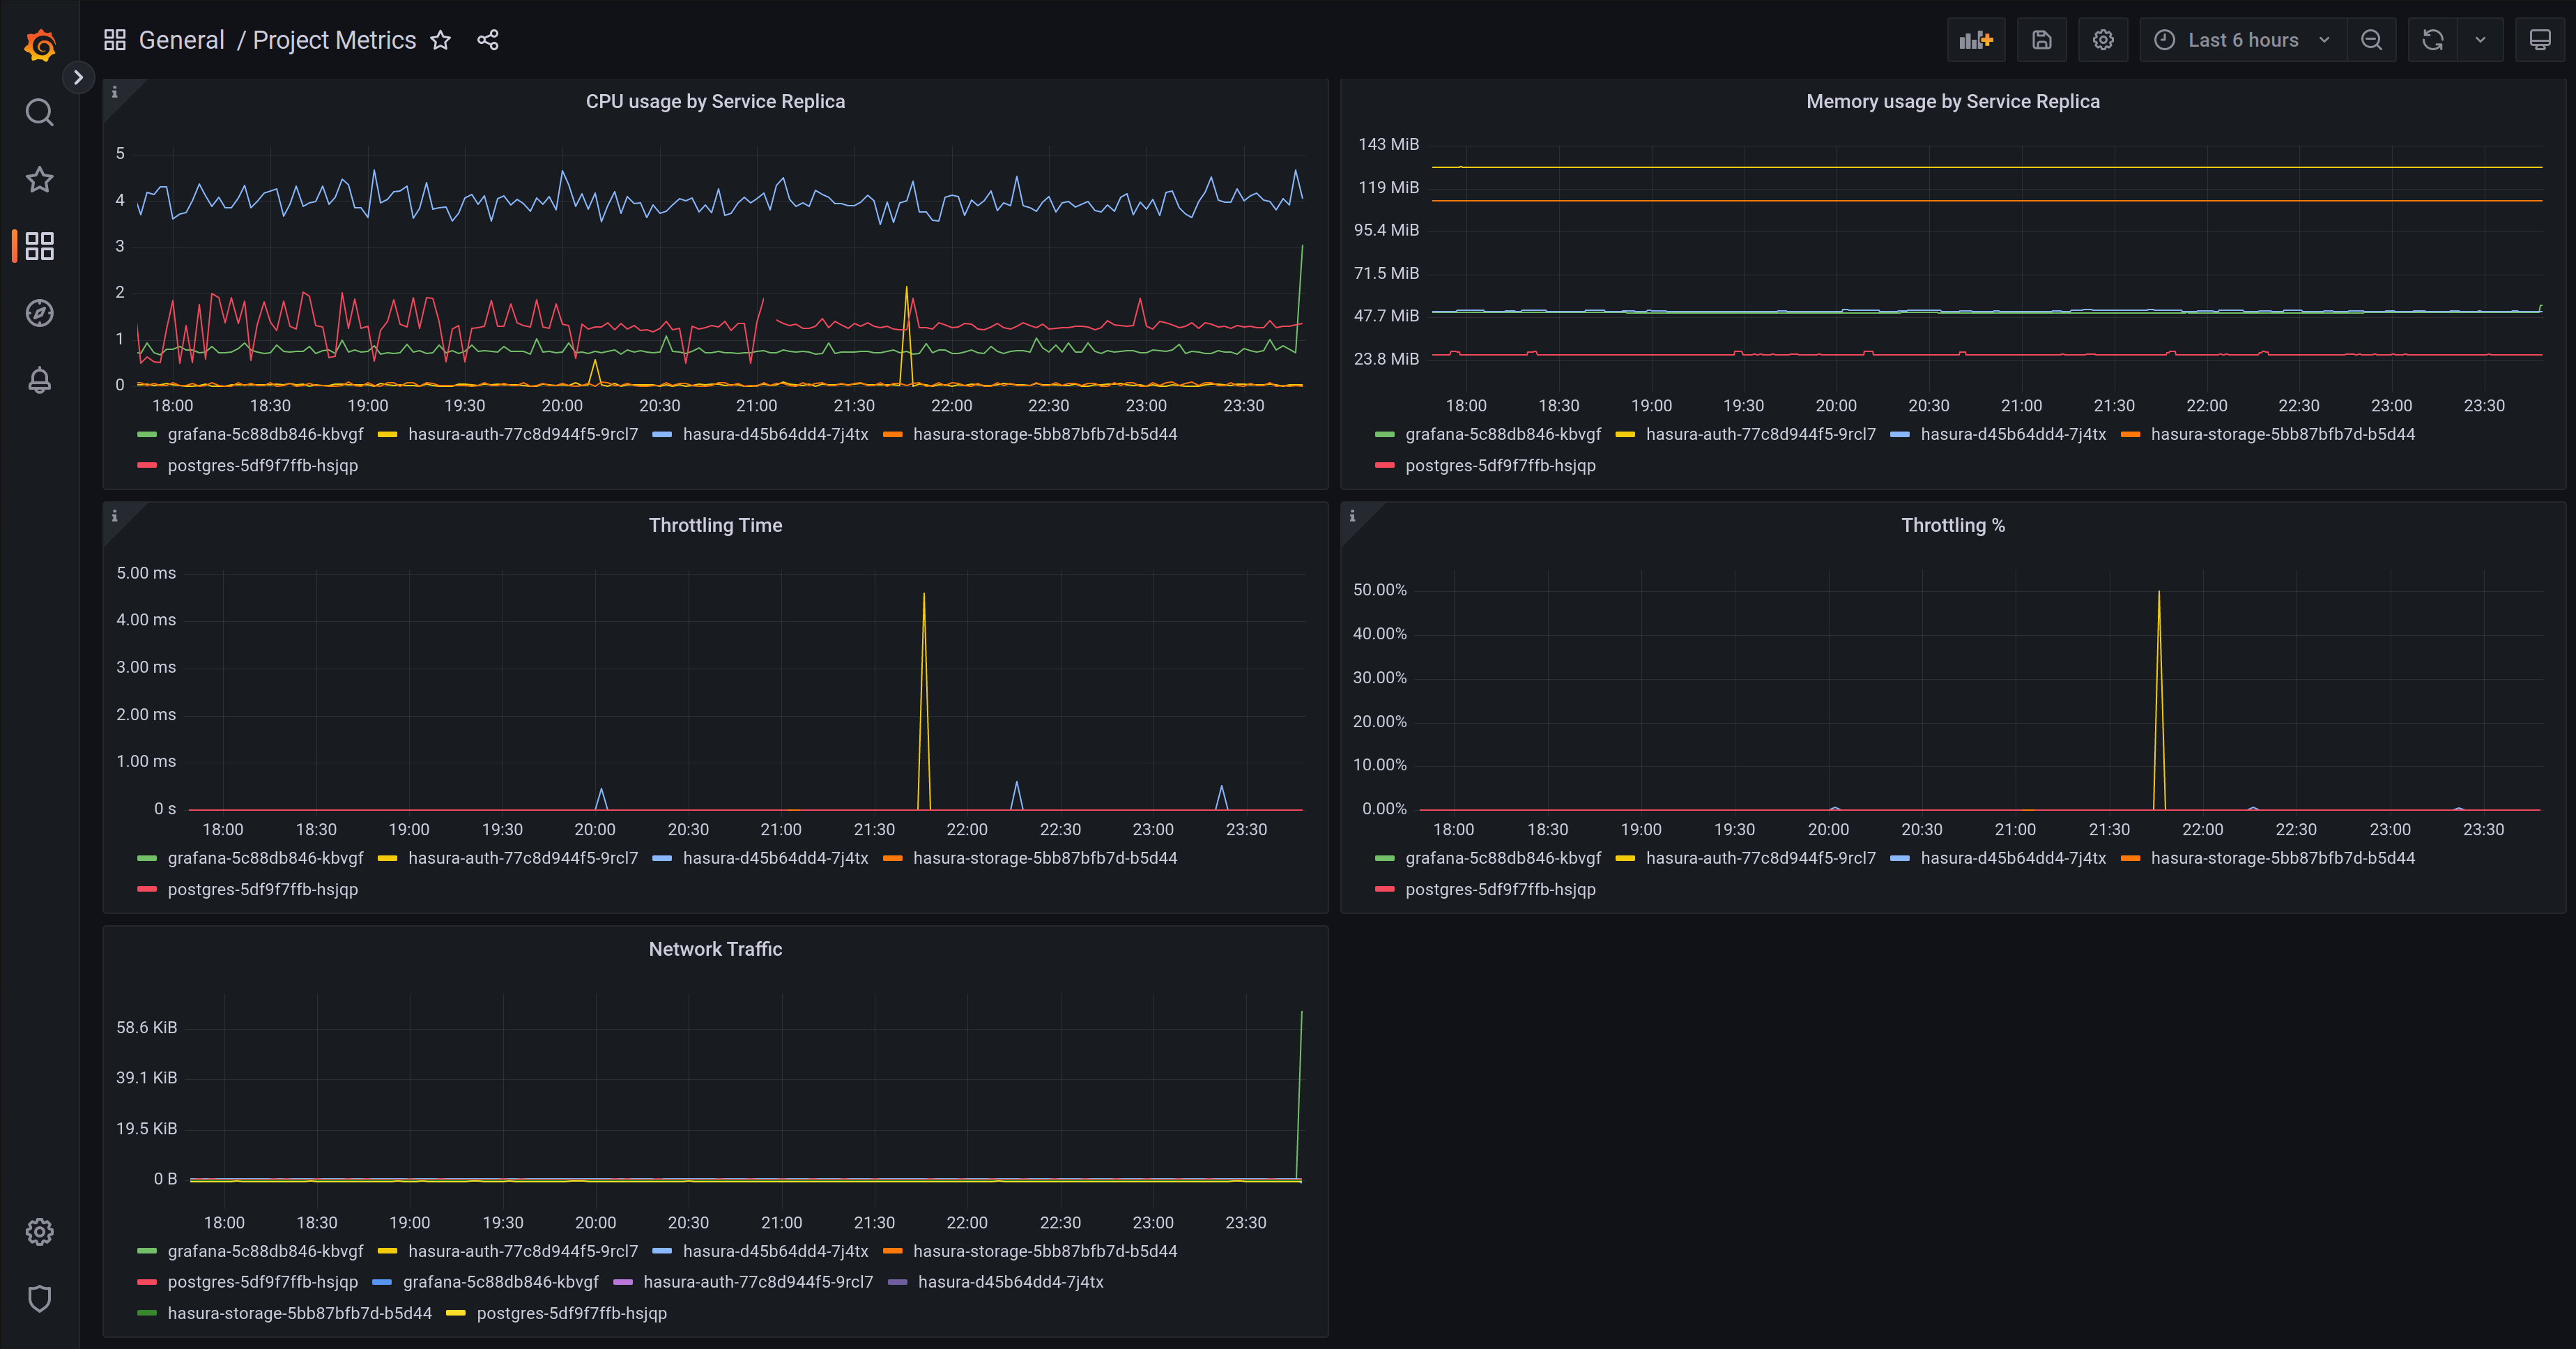
Section titled “Managed Grafana”Your Grafana instance comes pre-defined with dashboards that cover backend services, functions, and networking:
- vCPU/memory usage by Service replica for all services
- Throttling time / percentage
- Postgres volume usage
- Networking errors
- Functions metrics like calls, response times, errors
- and others, we keep adding new metrics and dashboards
Accessing Grafana
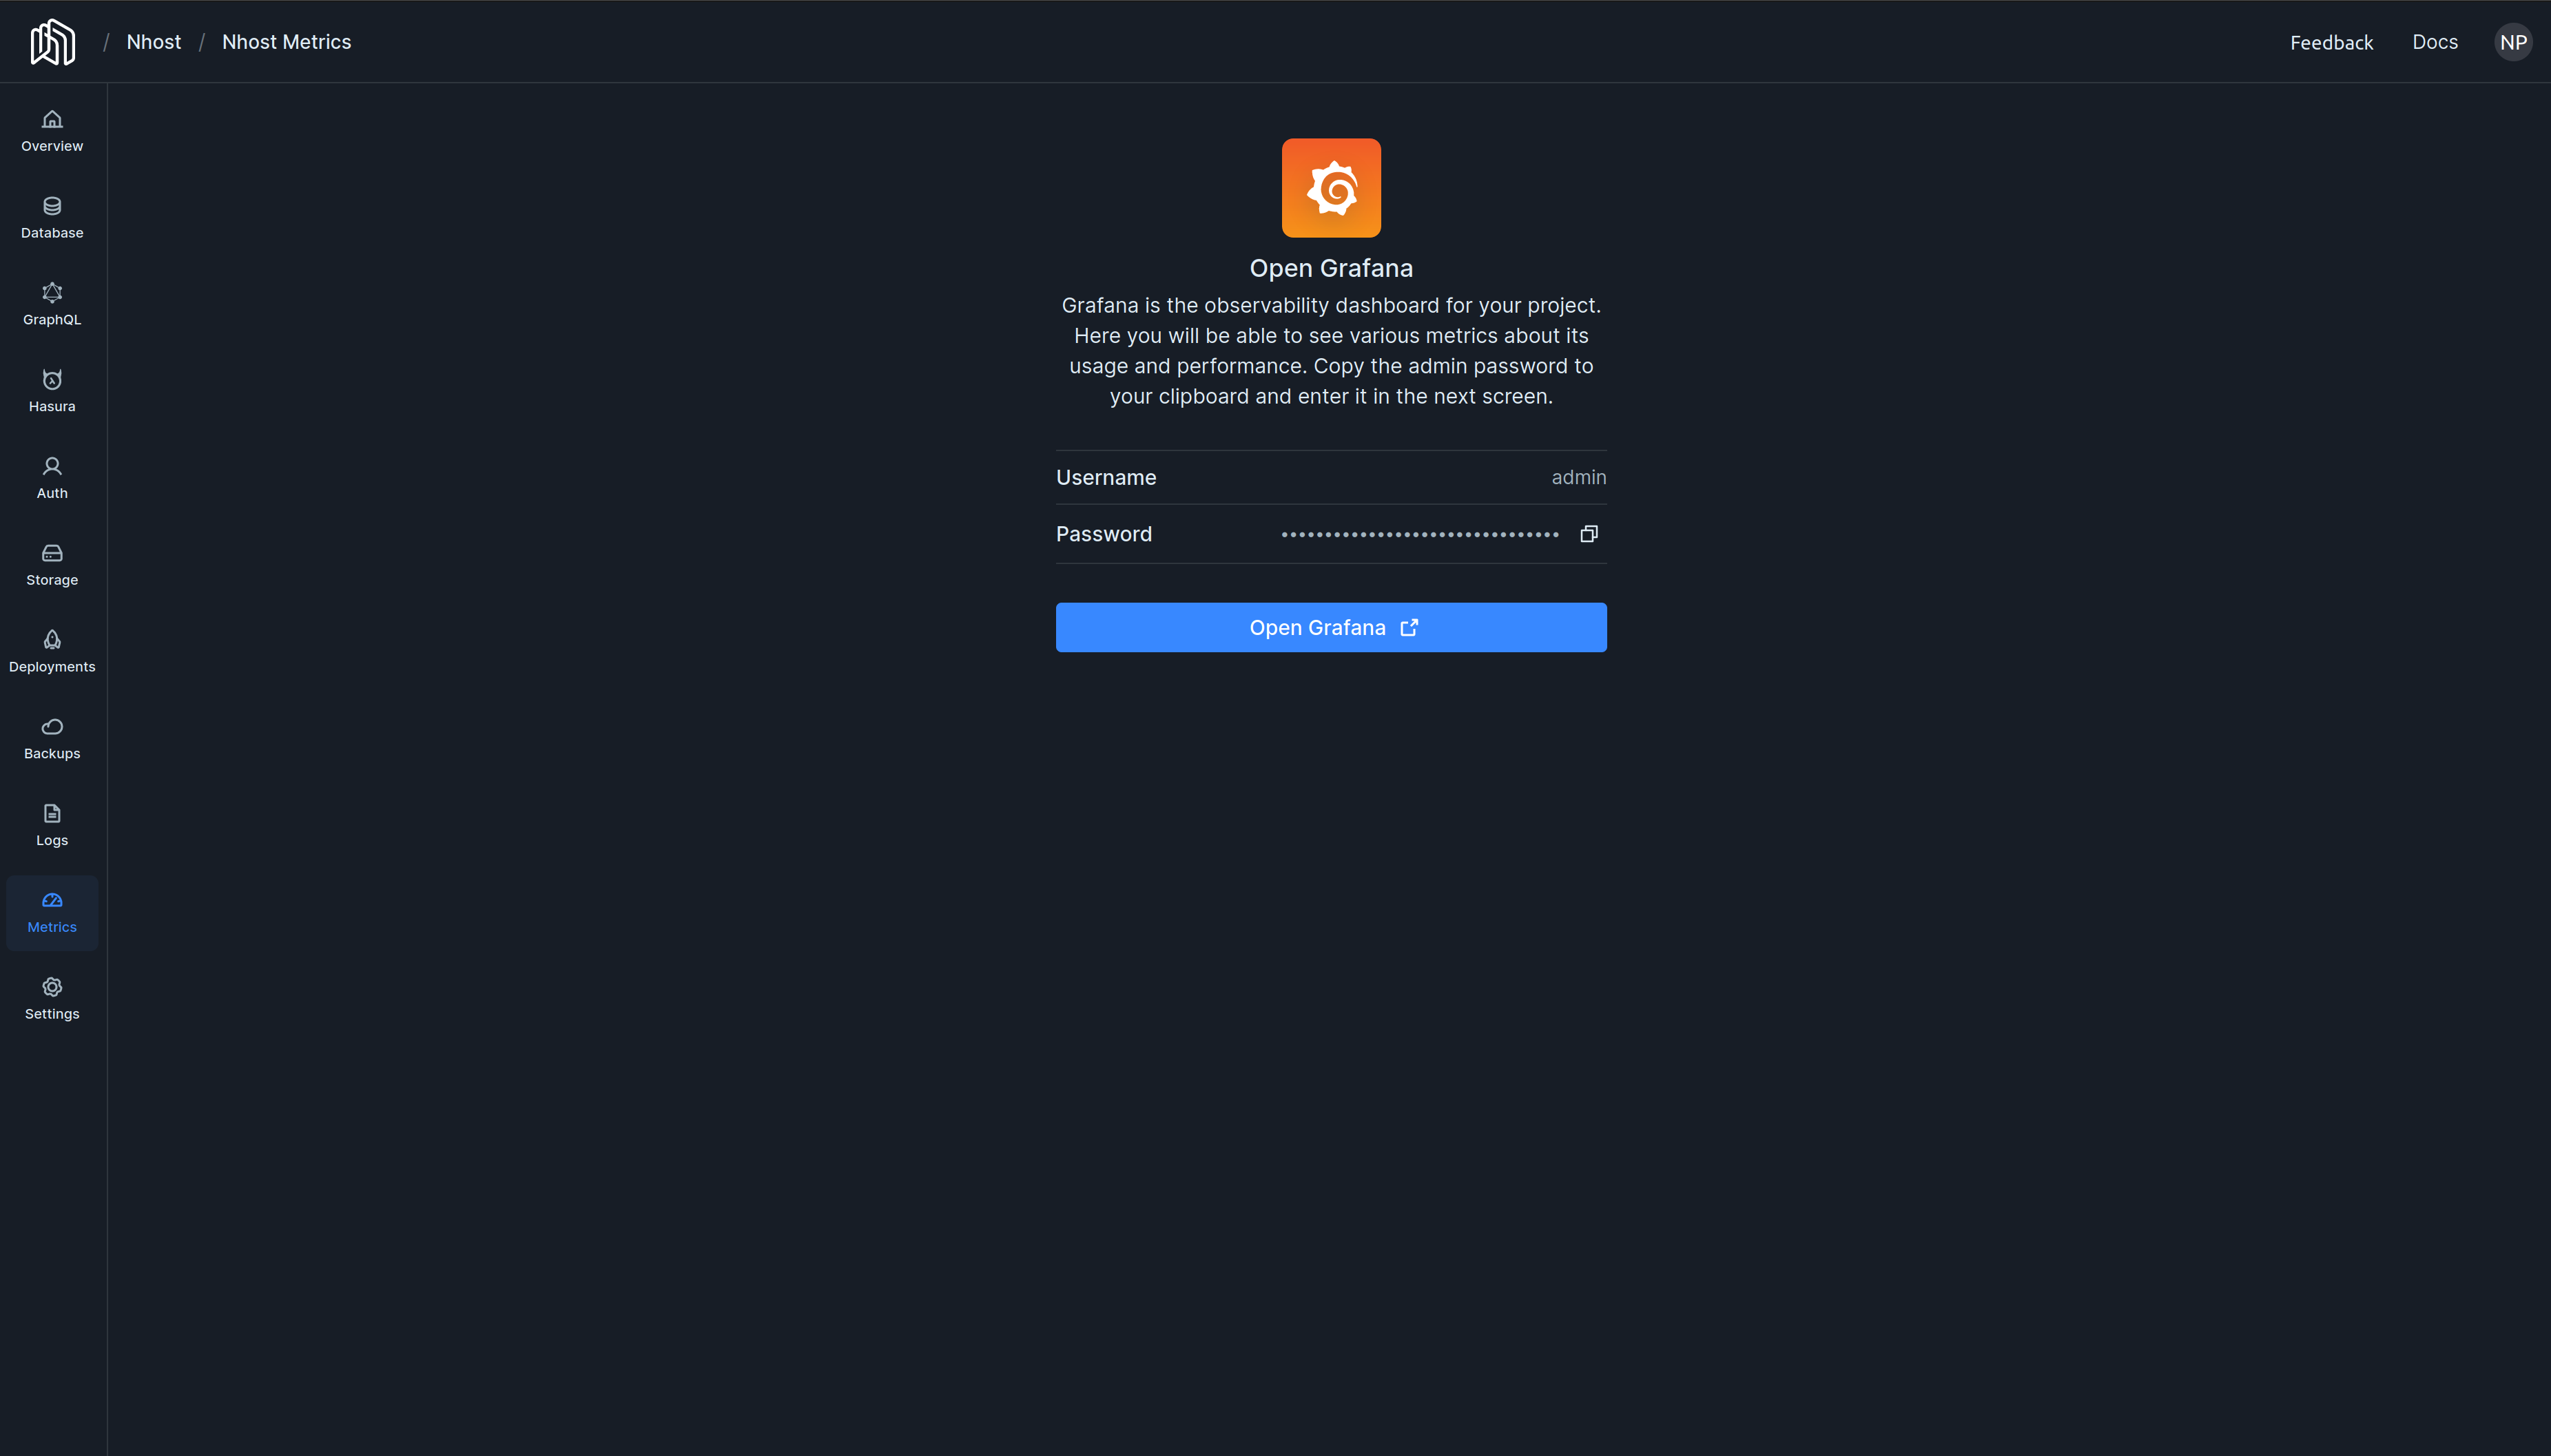
Section titled “Accessing Grafana”You can find the link to Grafana in your project’s dashboard, under Metrics.
Configuring Grafana
Section titled “Configuring Grafana”Grafana comes pre-configured with a datasource with your project’s metrics plus a few useful dashboards to observe your projects. In addition, you can enable alerting by configuring one or more contact points and enabling alerts in your configuration file.
Alerting
Section titled “Alerting”Project Dashboard -> Settings -> Observability
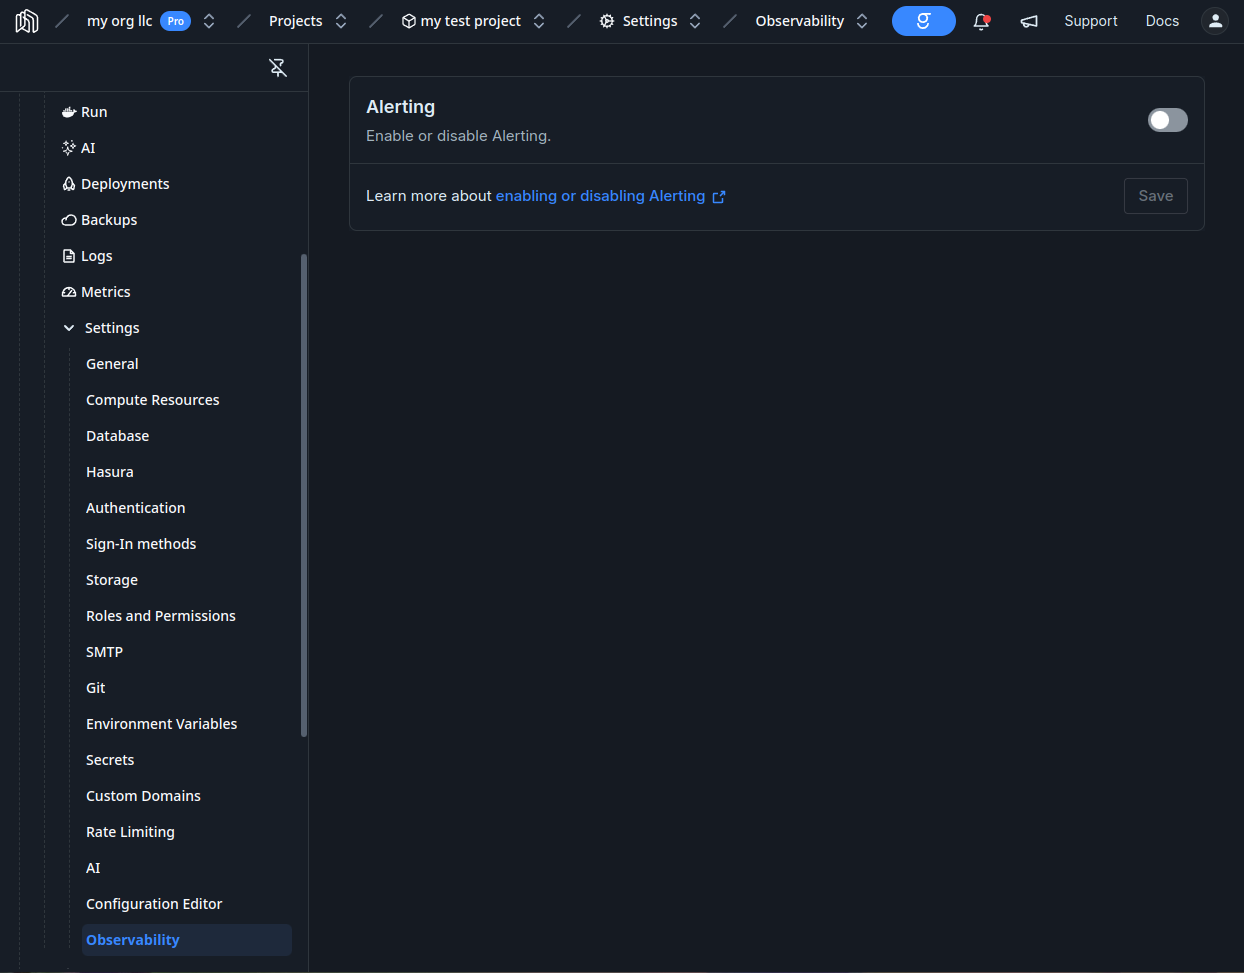
To enable alerting simply add to your configuration:
[observability.grafana.alerting]enabled = trueThis will enable the following rules, which you can find in your grafana dashboard under “Alert rules”:
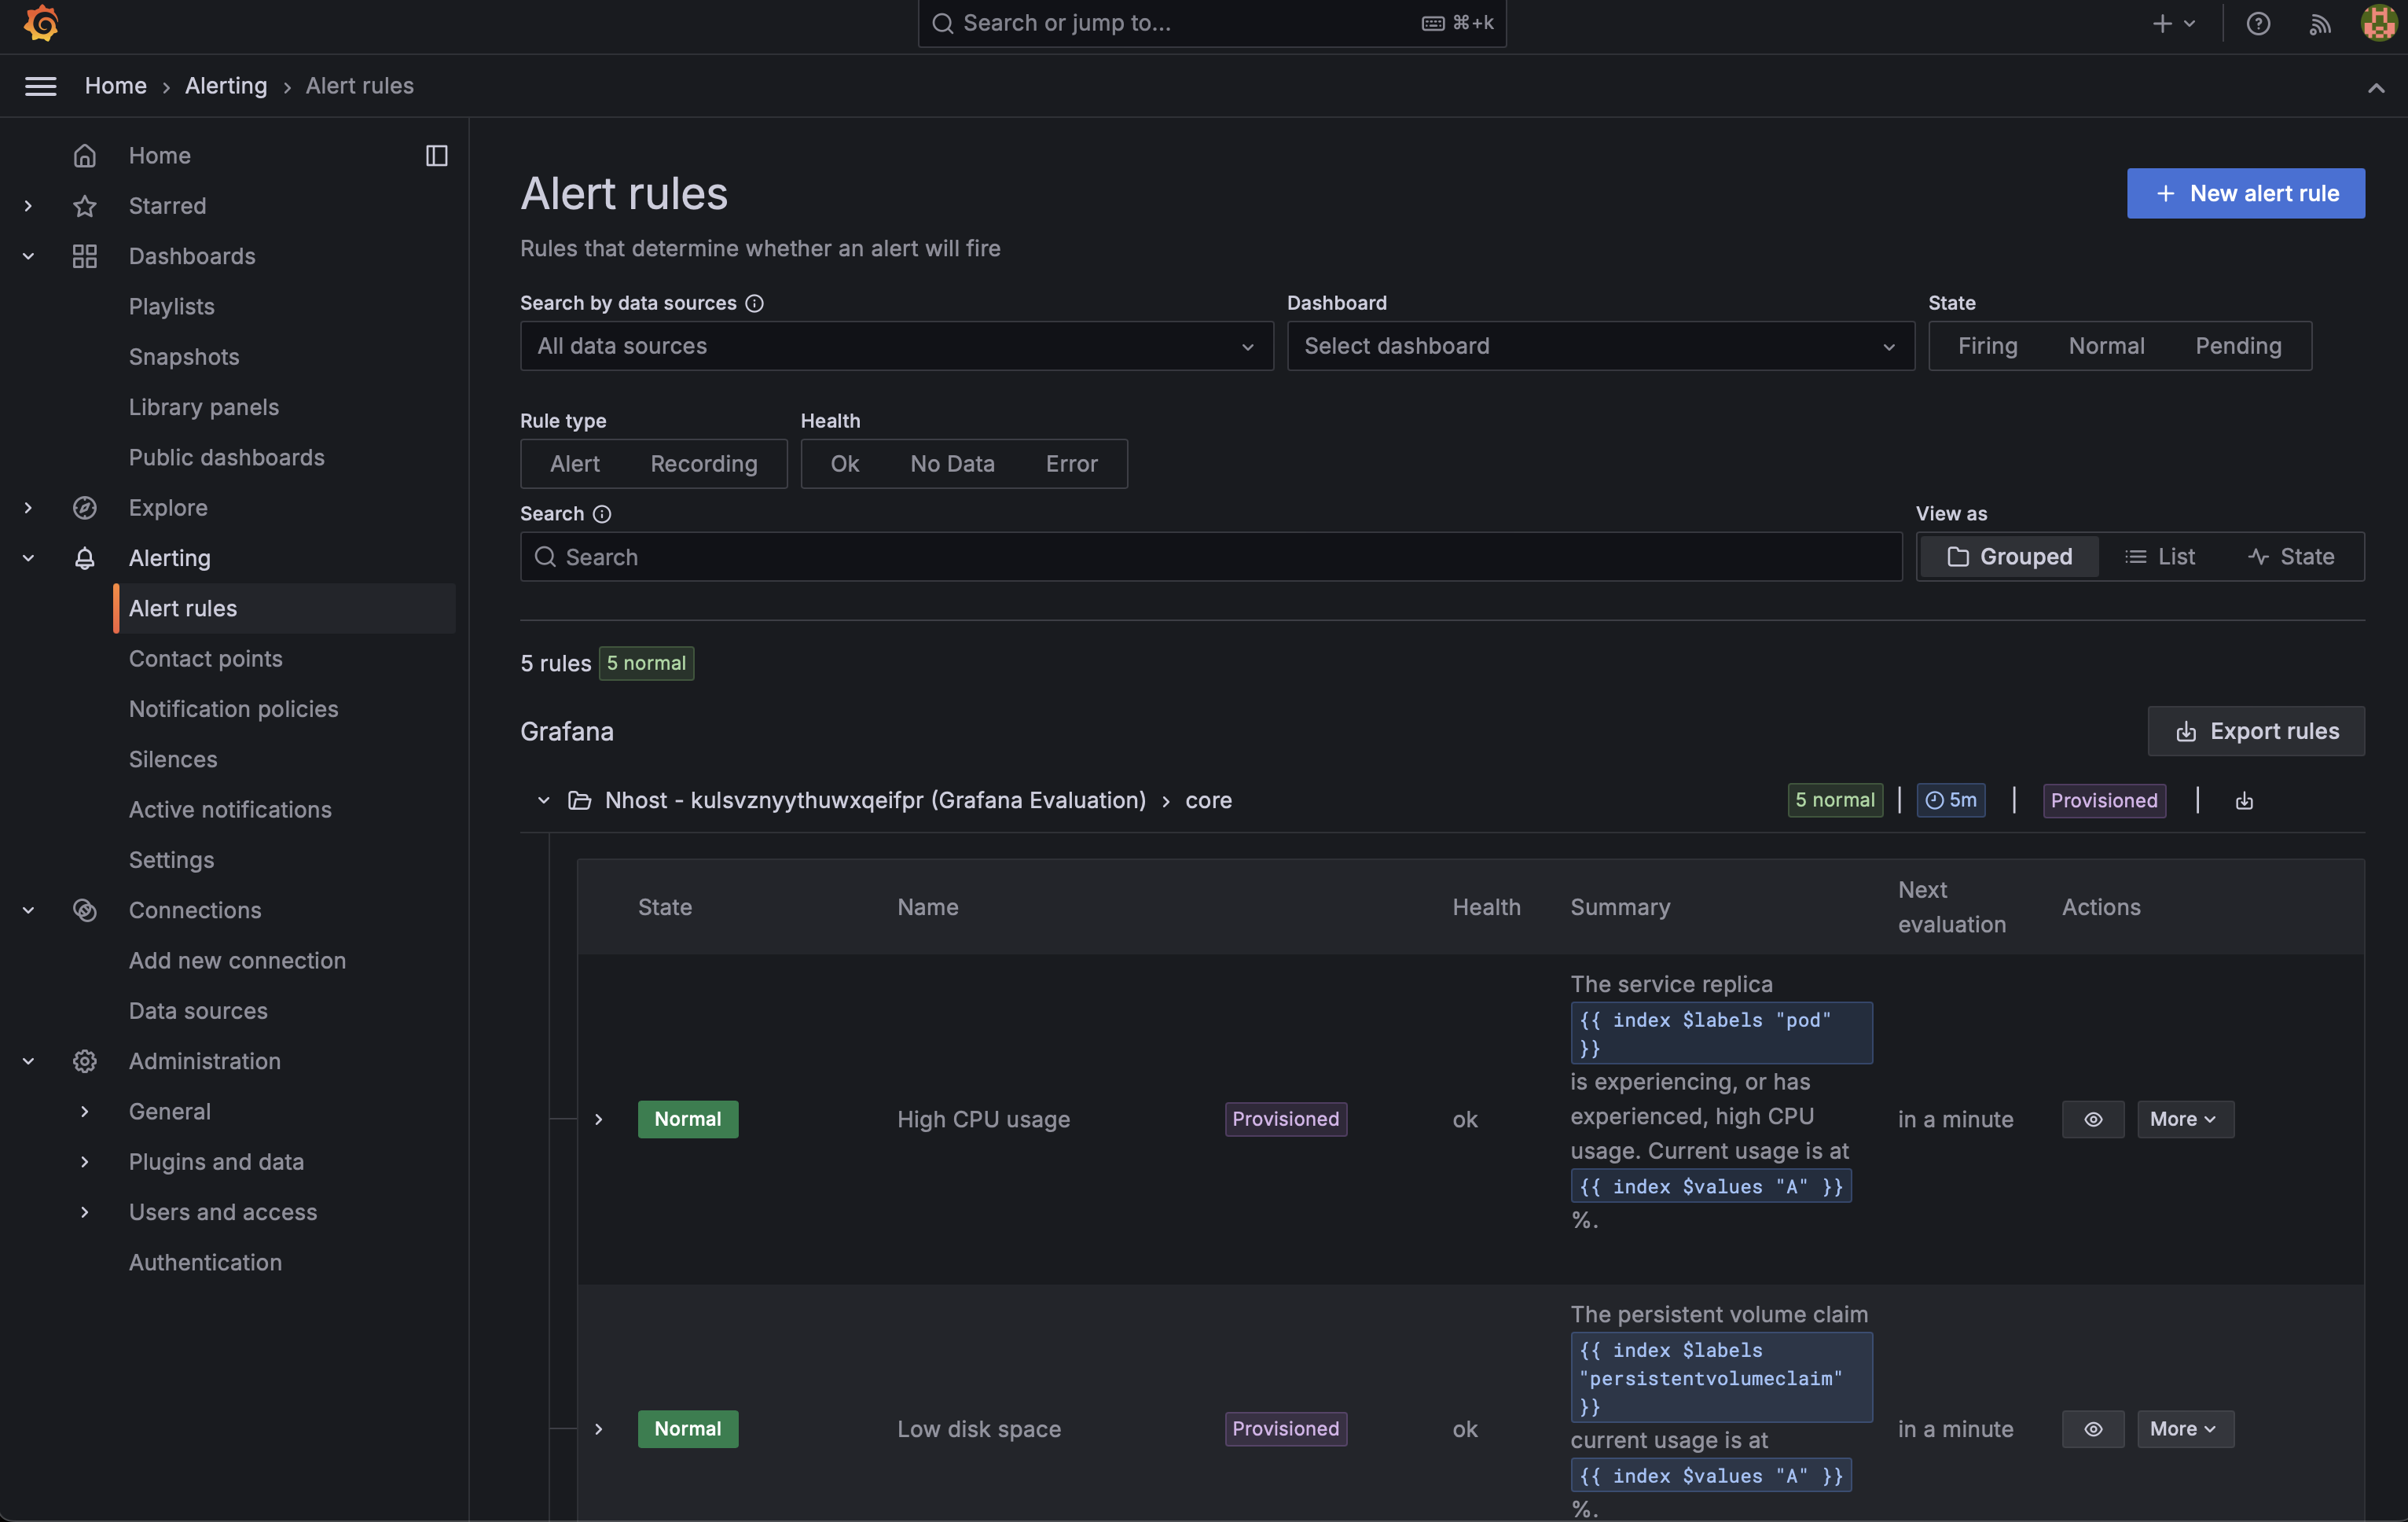
-
High CPU usage
- Trigger: CPU usage > 75%
- Duration: Sustained for 5-10 minutes
-
Low disk space
- Trigger: Disk utilization > 75%
- Duration: Persistent for 5-10 minutes
-
Low free memory
- Trigger: Memory usage > 75%
- Duration: Continuous for 5-10 minutes
-
Service restarted due to lack of memory
- Trigger: Any service restart due to memory exhaustion
- Duration: Immediate upon occurrence
-
High request error rate
- Trigger: Request error rate > 25%
- Duration: Maintained for 5-10 minutes
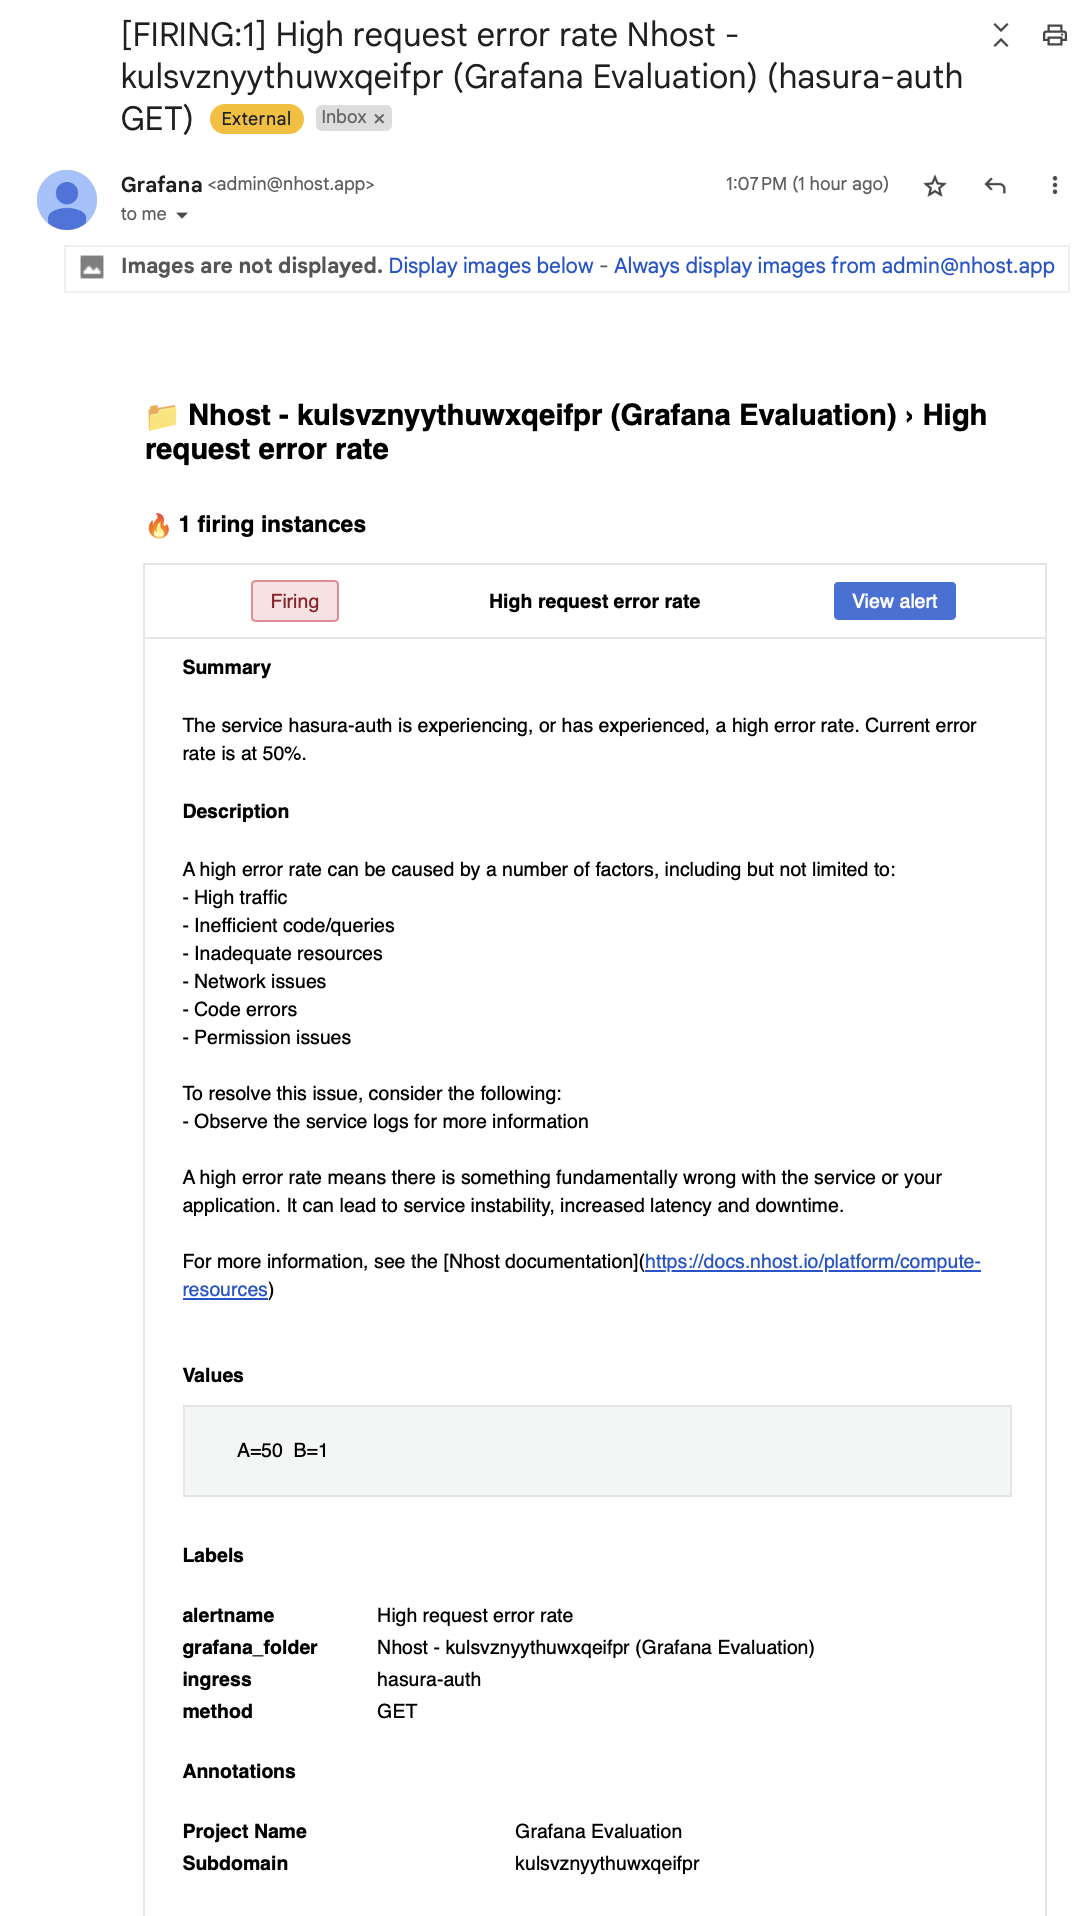
After they have been enabling they will start notifying your contact points when the conditions are met. For instance, here is an email sent due to a high error rate:
Configure contact points
Section titled “Configure contact points”Contact points in Grafana are lists of integrations that send notifications to specific channels or services when alerts are triggered. Supported contact points are:
- pagerduty
- discord
- slack
- webhooks
First, make sure you have enabled alerting as described above. Then, go to your project dashboard and click on Settings -> Observability -> Contact points:
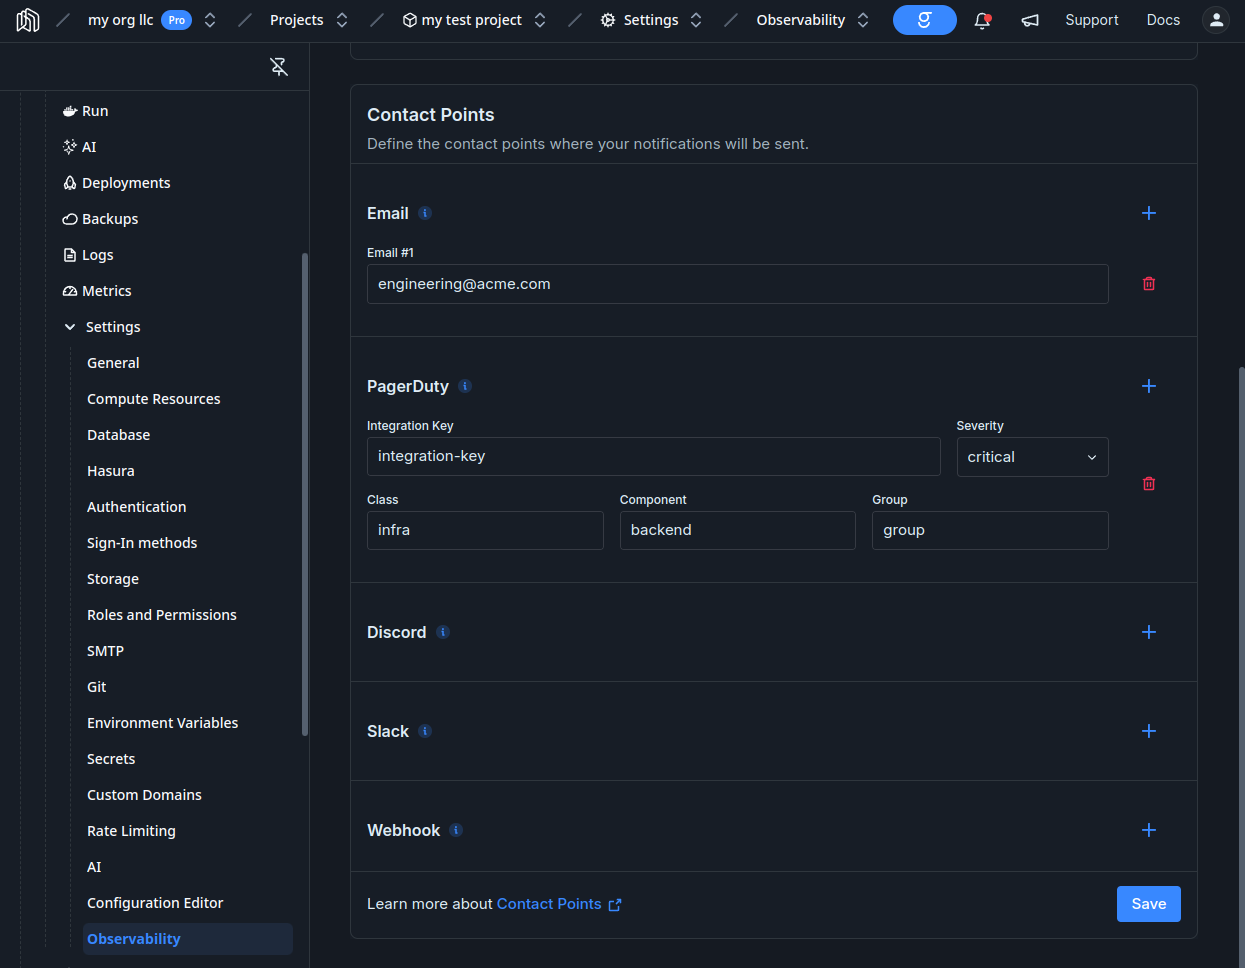
To configure them include one ore more sections in your configuration file:
[observability.grafana.contacts]emails = ['engineering@acme.com']
[[observability.grafana.contacts.pagerduty]]integrationKey = 'integration-key'severity = 'critical'class = 'infra'component = 'backend'group = 'group'
[[observability.grafana.contacts.discord]]url = 'https://discord.com/api/webhooks/...'avatarUrl = 'https://discord.com/api/avatar/...'
[[observability.grafana.contacts.slack]]recipient = 'recipient'token = 'token'username = 'username'iconEmoji = 'danger'iconURL = 'https://...'mentionUsers = ['user1', 'user2']mentionGroups = ['group1', 'group2']mentionChannel = 'channel'url = 'https://slack.com/api/webhooks/...'endpointURL = 'https://slack.com/api/endpoint/...'
[[observability.grafana.contacts.webhook]]url = 'https://webhook.example.com'httpMethod = 'POST'username = 'user'password = 'password'authorizationScheme = 'Bearer'authorizationCredentials = 'token'maxAlerts = 10
Once you have added them to your configuration and deployed them you should be able to see them in your grafana dashboard under “Settings” -> “Contact points” -> “Nhost Managed Contacts”:
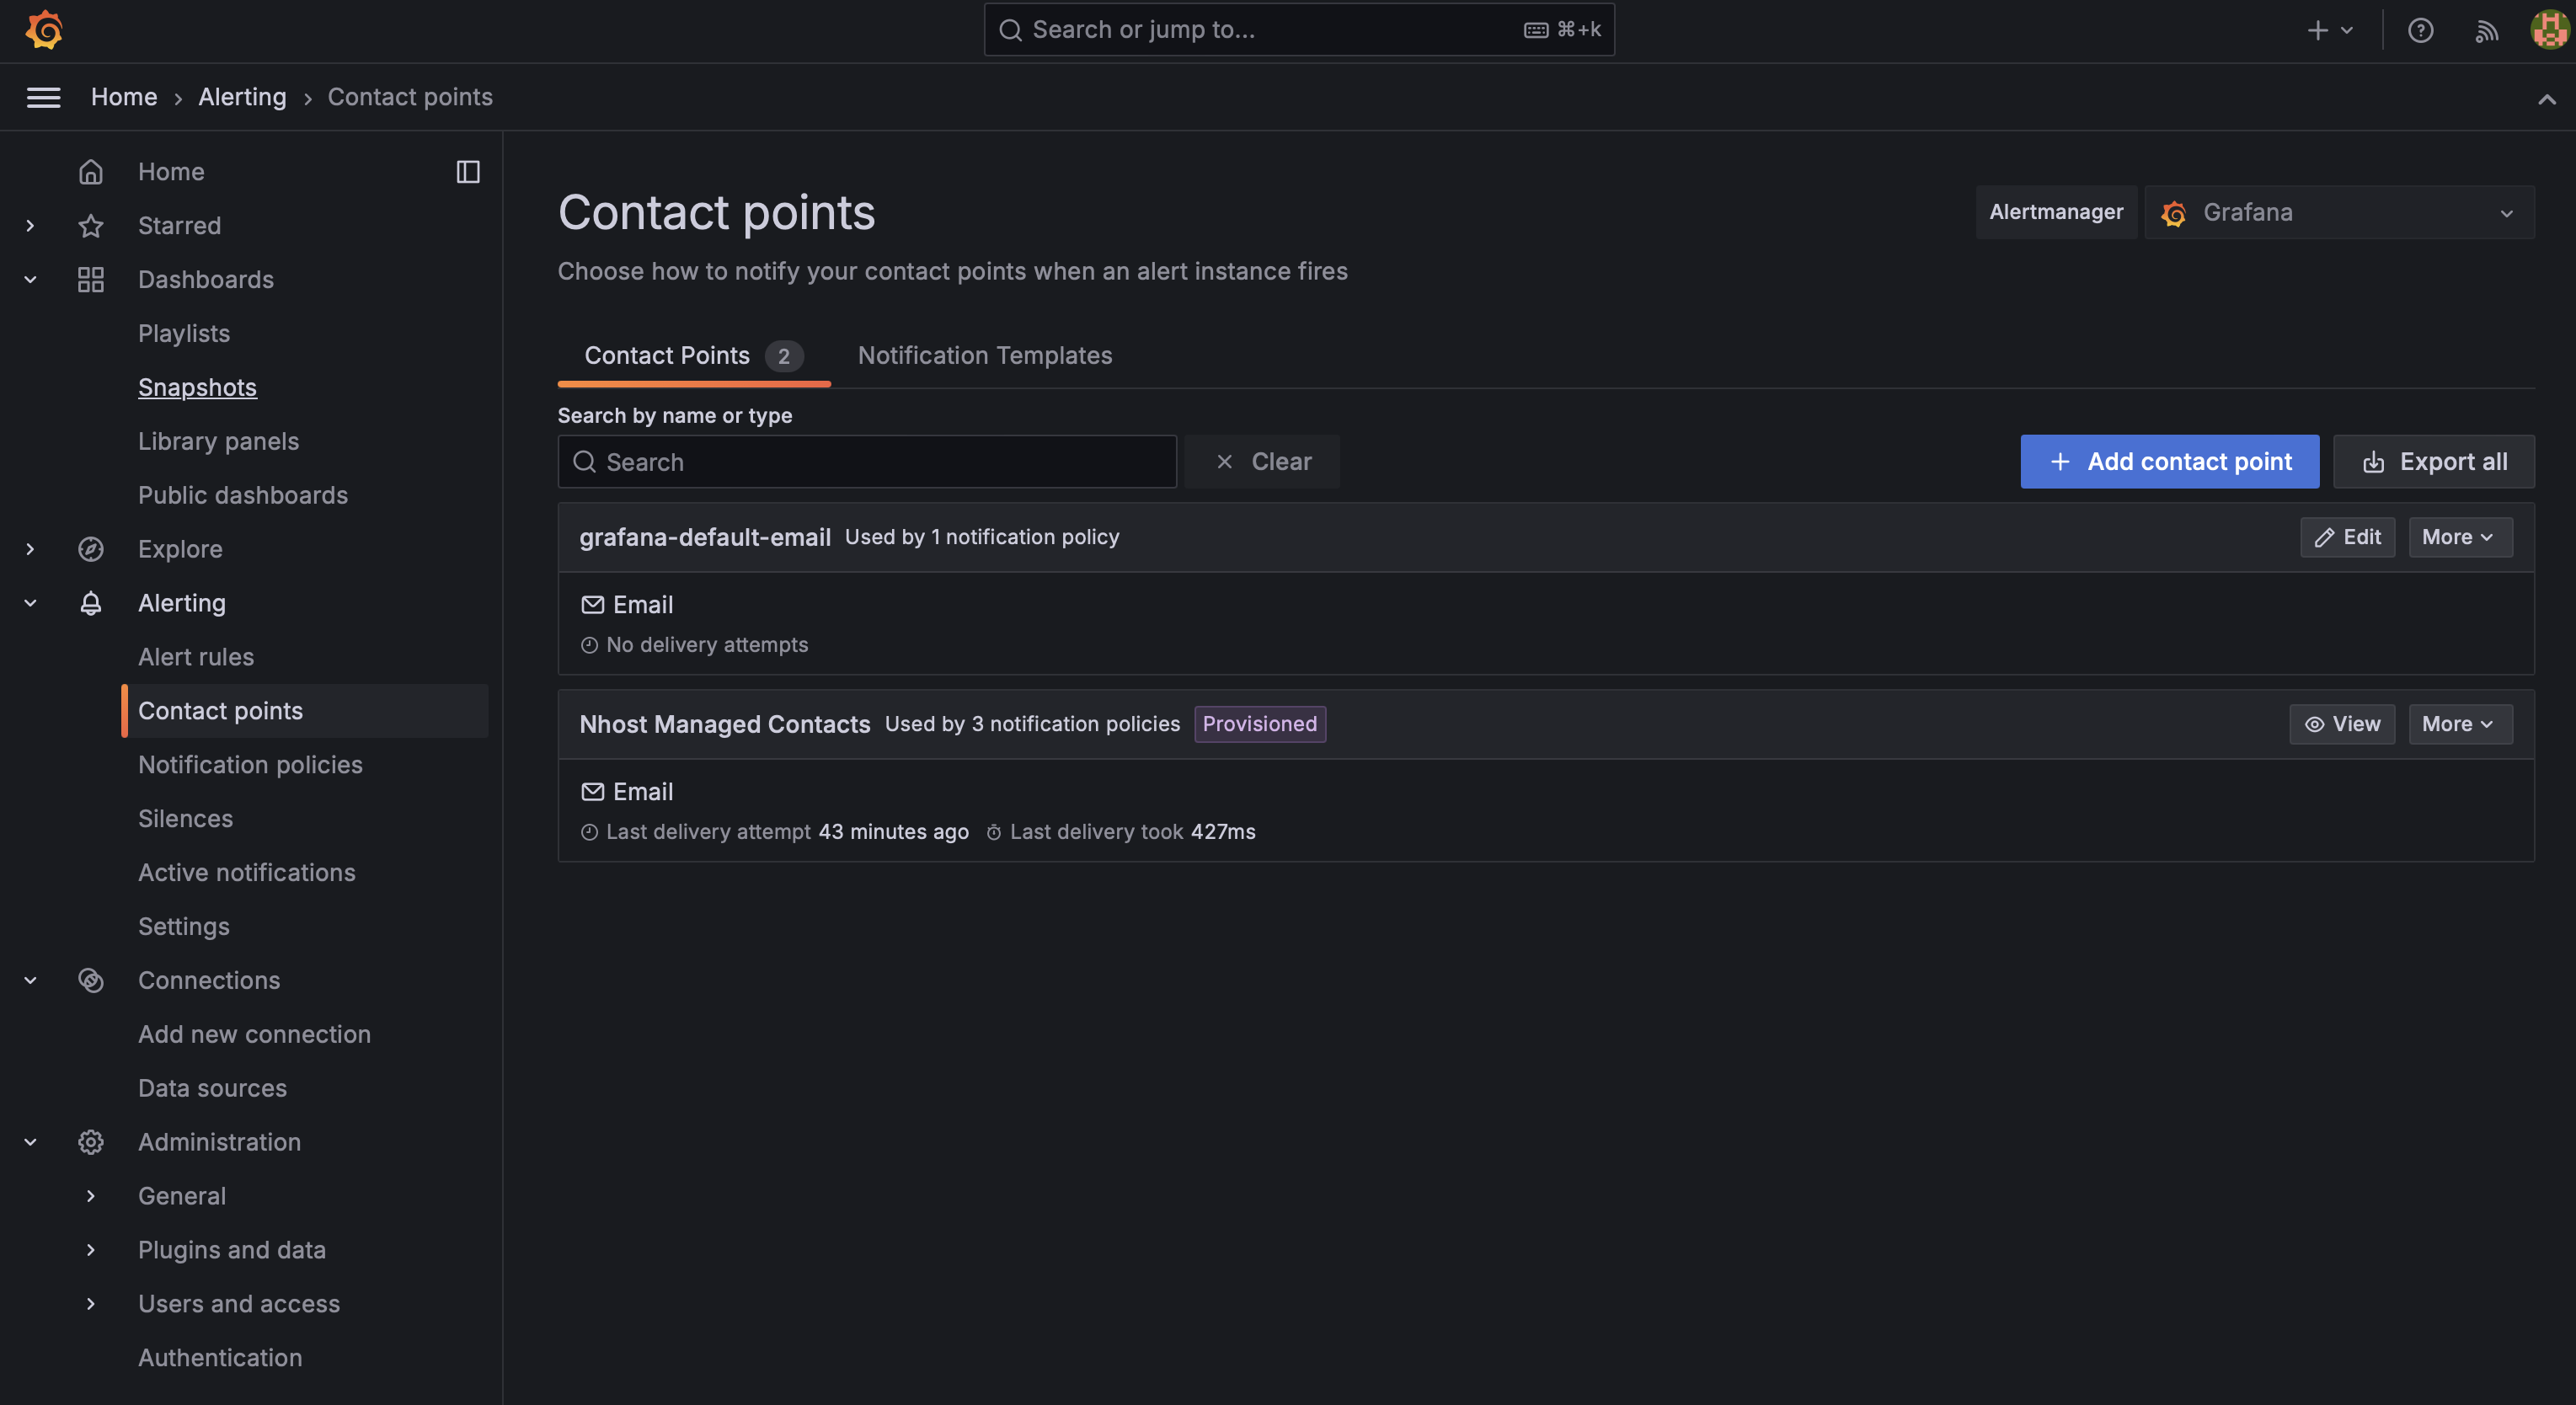
If you click on “View” you should be able to see a test button you can use to ensure your contacts are properly configured.
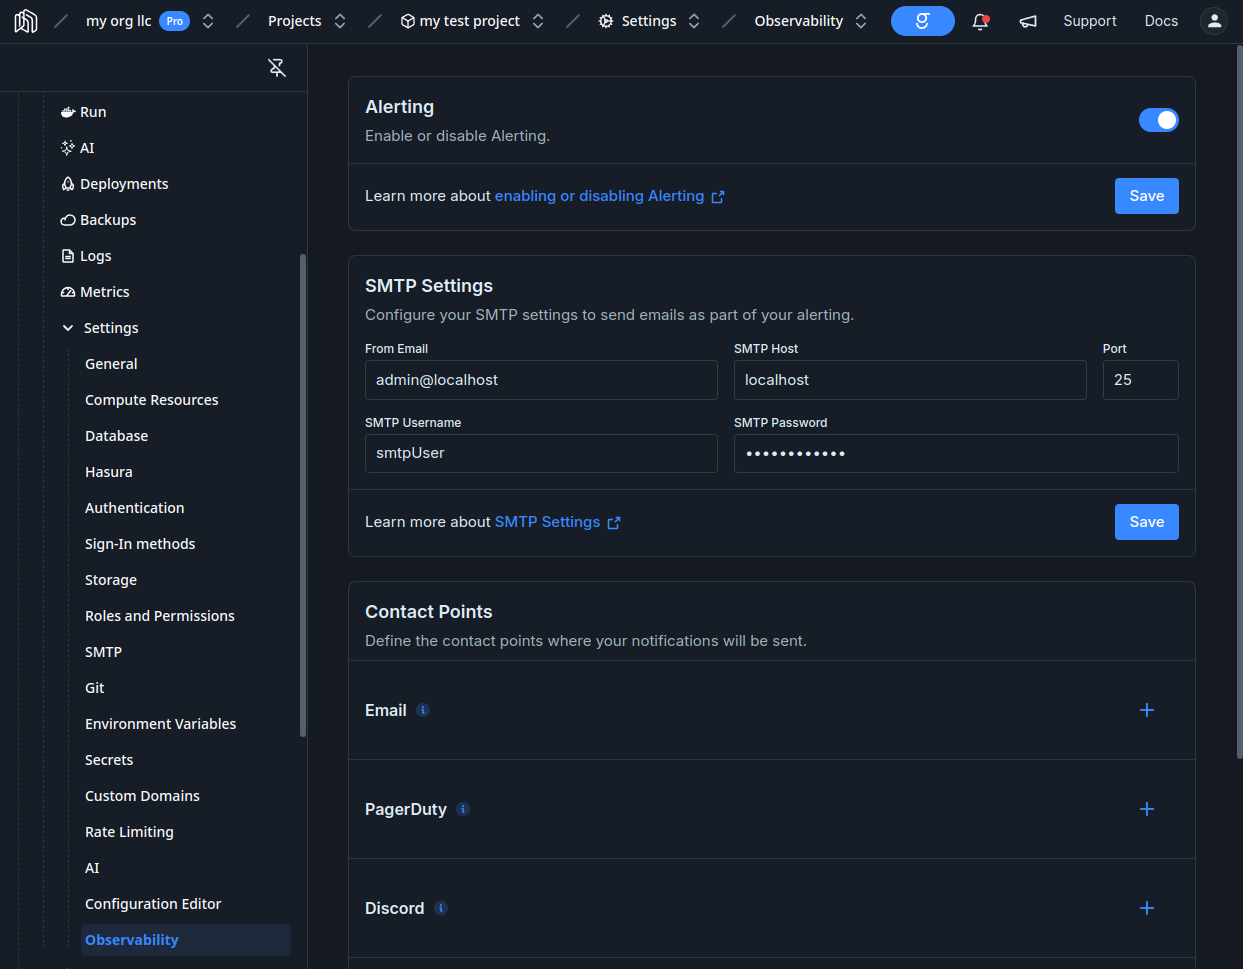
If you are planning to send emails as part of your alerting, you need to configure some SMTP settings as well.
First, make sure you have enabled alerting as described above. Then, go to your project dashboard and click on Settings -> Observability -> SMTP Settings:
Add to your configuration:
[observability.grafana.smtp]host = 'localhost'port = 25sender = 'admin@localhost'user = 'smtpUser'password = 'smtpPassword'Advanced configuration
Section titled “Advanced configuration”In addition, Team and Enterprise projects can perform any changes they want. For instance you can add users, configure an OAuth provider for user authentication, add datasources, you can configure your own alerts, etc.
Metrics is in beta, its functionality and pricing might change.